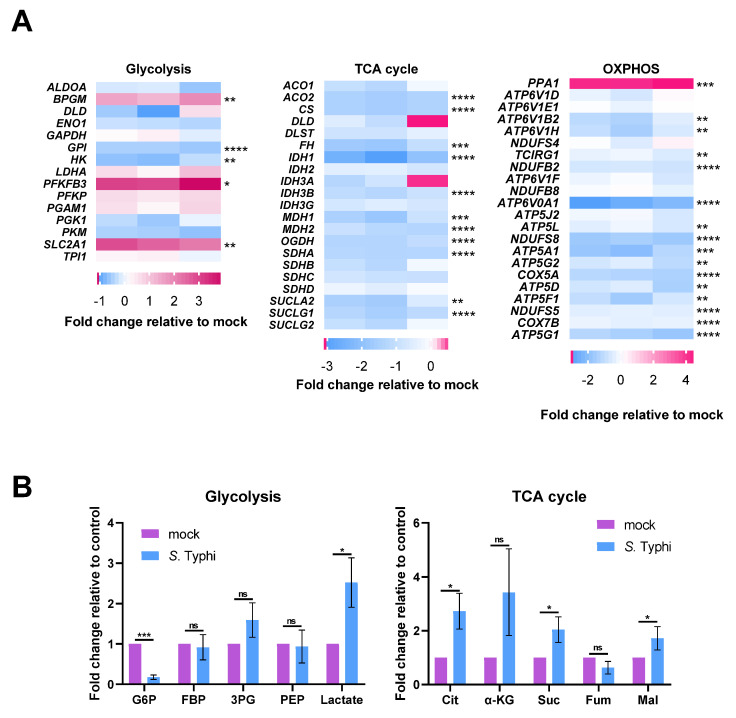
Figure 2.
Transcriptomes and metabolomics analysis show Salmonella enterica serovar Typhi (S. Typhi) infection increases glycolysis while suppressing the tricarboxylic acid (TCA) cycle and oxidative phosphorylation (OXPHOS) in human macrophages. (A), Heat map of the gene expression of glycolytic metabolism (left), the TCA cycle (middle), and OXPHOS (right) in S. Typhi-infected MDMs vs. mock-infected MDMs. Fold changes of the relative gene expression levels are displayed in the heat maps, with pink representing higher and blue representing lower abundance. (B) Fold change in metabolites of glycolysis (left) or the TCA cycle (right) in S. Typhi-infected MDMs vs. mock-infected MDMs. Glucose 6-phosphate (G6P), fructose-1,6-diphosphate (FBP), 3-phosphoglycerate (3PG), phosphoenolpyruvate (PEP), citrate (Cit), α-ketoglutarate (α-KG), succinate (Suc), fumarate (Fum), malate (Mal). (A,B) Data were obtained from three independent experiments and analyzed using one-way ANOVA. * p < 0.05; ** p < 0.01; *** p < 0.001; **** p < 0.0001; ns, not significant.

