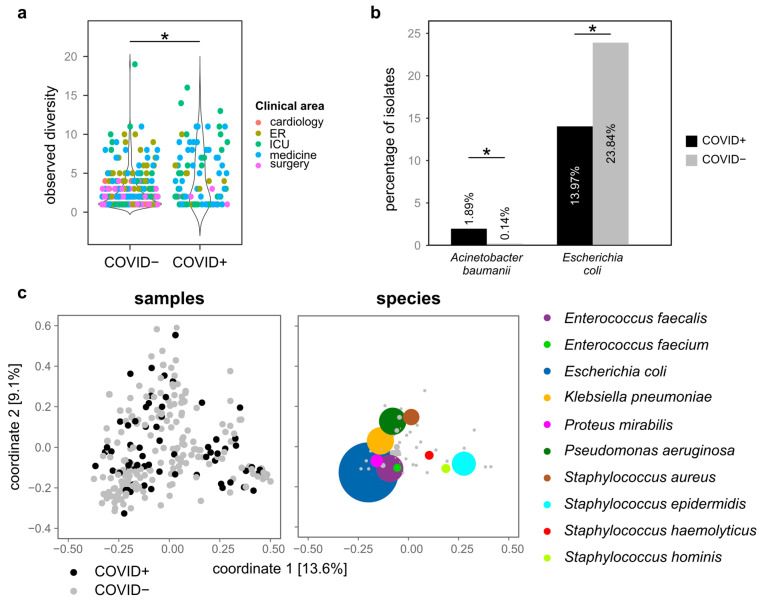
Figure 2.
Distribution of bacterial species among patients. (a) Observed number of species per patient, grouped according to the COVID-19 status. Each point indicates a different group of strains (grouped as being isolated in the same month and year, from patients hospitalized in the same clinical area and being either COVID+ or COVID−). (b) Species whose abundance significantly differed among COVID+ and COVID− patients. (c) First two coordinates of the principal coordinate analysis based on the Jaccard distances calculated among samples grouped as described for panel a. On the left part, the distribution of isolates, on the right part the distribution of the most abundant bacterial species. * = Wilcoxon-Mann-Whitney p value < 0.05.

