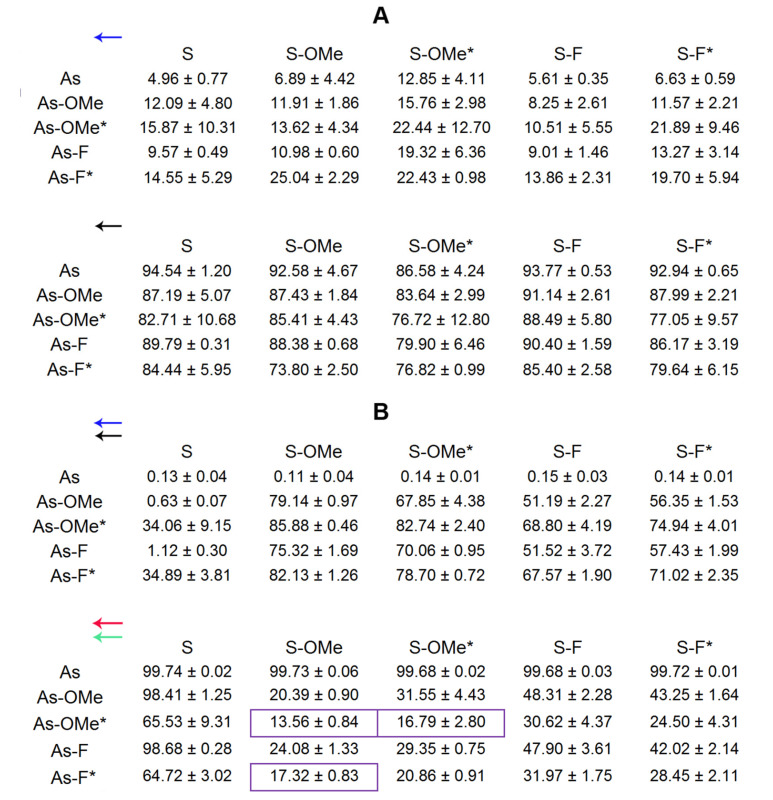
Figure 5.
Cleavage levels (%) of siRNAs by RNAse A, as determined in autoradiographs ((A), two blocks) and fluorescent scanning gel images ((B), two blocks). The leftmost column in each block shows types of antisense chains; upper rows indicate types of sense chains. Each block contains data on the cleavage extent of a particular siRNA site. The blue arrow in the upper block of (A) means that this block shows the extent of cleavage of the U18 site in the sense chains of the duplex. The black arrow in the bottom block of (A) means that this block presents the extent of cleavage of the C4 site in an antisense strand. The double blue-and-black arrow in the upper block of (B) means that this block shows the extent of cleavage of the U18 site in sense chains and of the C4 site in antisense chains. The double red-and-green arrow in the bottom block of (B) means that this block shows the extent of cleavage of U12 and C16–U17 sites in antisense chains. The most stable siRNAs are boxed (violet frames). The extent of the degradation was calculated as the ratio of the intensity of a given band to the total intensity of all bands in a lane, multiplied by 100%. A lower value means lower degradation. Relative error in all the experiments did not exceed 20%. The asterisk (*) means the PG-modified chain. The data are presented as mean ± standard deviation from at least three independent experiments.

