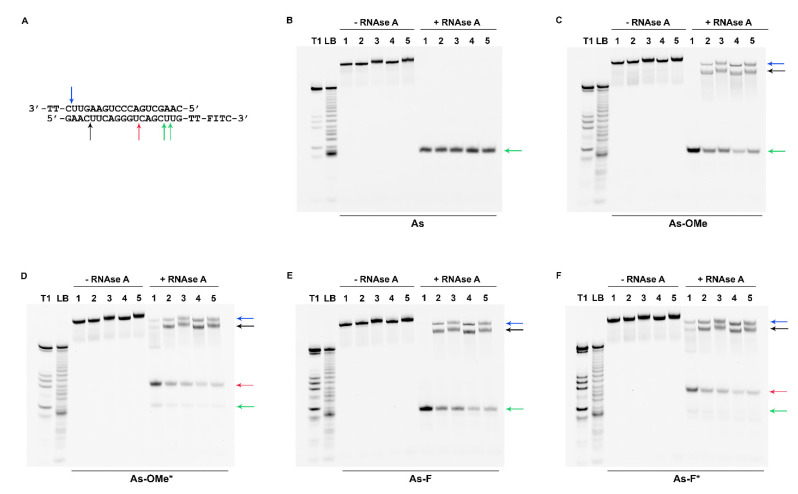
Figure 6.
The products of siRNA duplex degradation after 7.5 µg/mL RNAse A treatment, according to denaturing PAGE. (A). The black arrow indicates cleavage sites C4 identified in an FITC-labeled antisense strand; red arrow: U12 in an FITC-labeled antisense strand; green arrow: the C16 or U17 site in an FITC-labeled antisense strand; blue arrow: U18 in the unlabeled sense strand of the duplex. (B–F): Gel images of 20% PAAGs with corresponding FITC-labeled antisense chains; +RNase A: duplexes treated with Rnase A; -RNAse A: control (undigested) duplexes. Each sample contained 32P-labeled and FITC-labeled antisense chains of the same structure (1.5 and 50 pmol, respectively) and 55 pmol of an unlabeled sense chain. Antisense strands are designated at the bottom of each image (B: As, C: As-Ome, D: As-Ome*, E: As-F, and F: As-F*). Lane 1 contains a native sense (S) chain in all images. Other lanes contain a modified sense chain: Lane 2: S-F, Lane 3: S-F*, Lane 4: S-Ome, and Lane 5: S-Ome*. The products of degradation of FITC-labeled siRNAs duplexes were visualized in the gel via scanning and recording of an image using a VersaDocTM MP 4000 Molecular Imager® System (Bio-Rad) after laser excitation at 488 nm. Lanes LB and T1 present the stochastic hydrolysis in 50 mM NaHCO3–Na2CO3 buffer (pH 9.5) and partial digestion of FITC-labeled As with Rnase T1, respectively. The asterisk (*) means the PG-modified chain.

