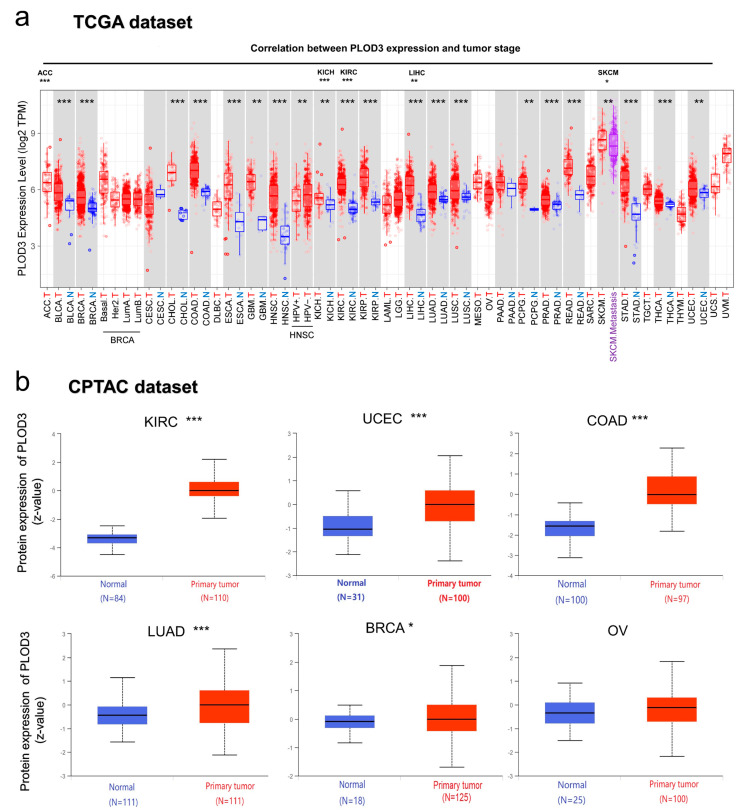
Figure 3.
PLOD3 expression in different cancers. (a) The PLOD3 expression level in different cancers or specific cancer subtypes. N—normal and T—tumor tissue; (b) The PLOD3 total protein expression between tumor tissue and corresponding normal tissue according to the CPTAC dataset. * p < 0.05; ** p < 0.01; *** p < 0.001.

