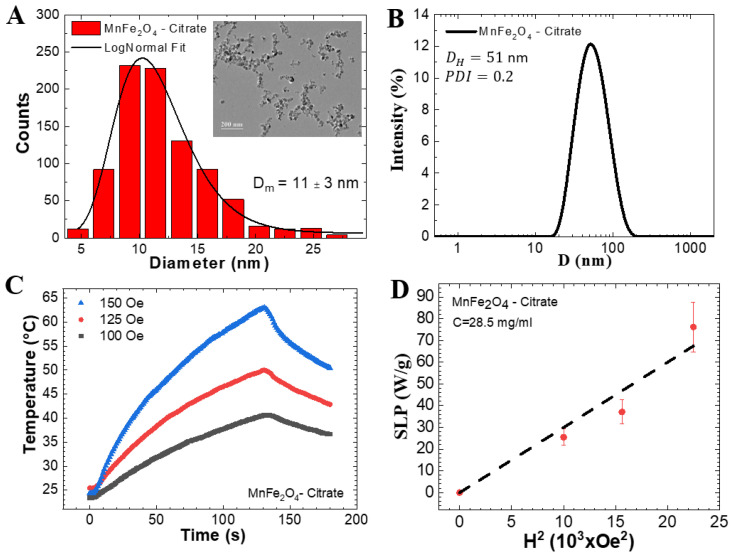
Figure 2.
(A) Particle size distribution obtained from analysis of TEM pictures. Inset shows a representative TEM picture. (B) Dynamic light scattering data of the Mn-ferrite based colloid. (C) In vitro MNH temperature profile of a magnetic sample in three magnetic field amplitudes for a frequency of 333 kHz. (D) Specific loss power (SLP) as function of the square of the magnetic field. Data obtained using a particle concentration of 28.5 mg/mL.

