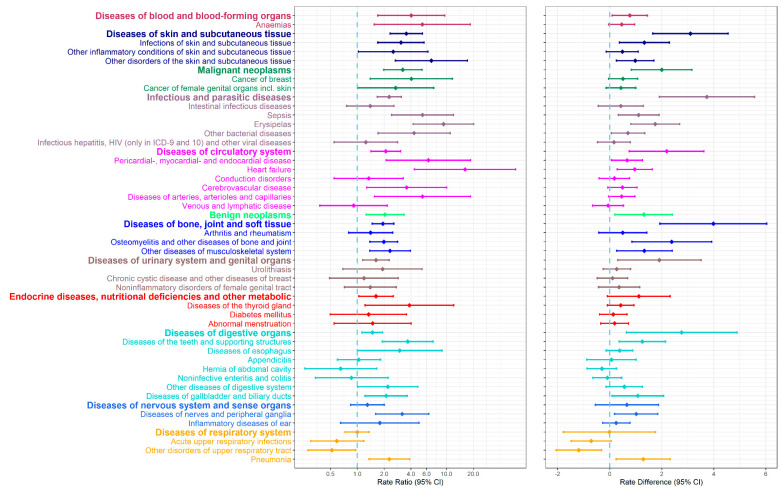
Figure 3.
Rate ratios of hospital contacts, rate differences per 1000 person years, and 95% confidence intervals (CIs) for first diagnosis of each of the 120 specific disease categories for survivors compared with the matched comparisons. Only diseases for which survivors had five or more hospital contacts are shown.

