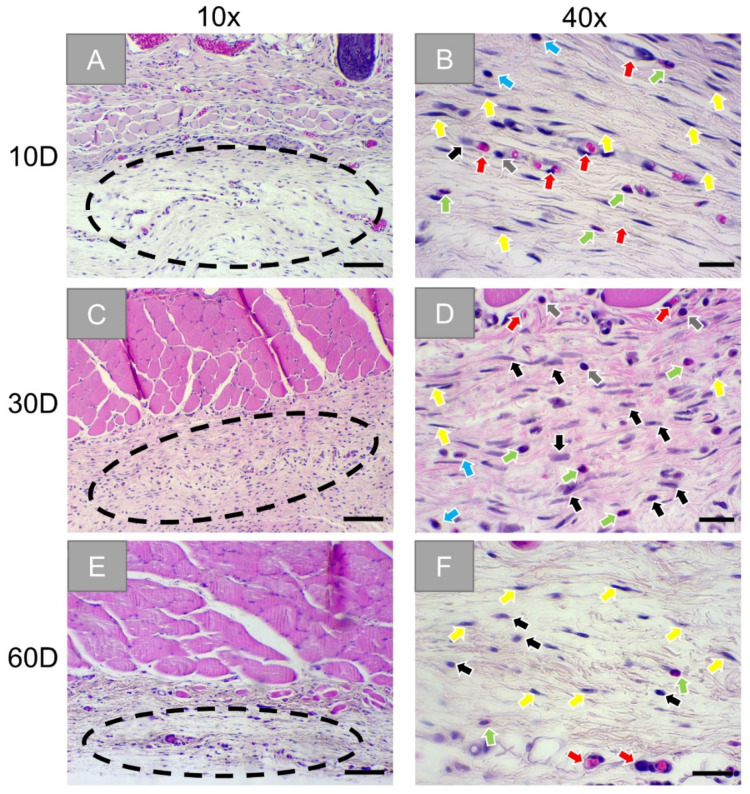
Figure 5.
Exemplary histological images of the tissue reactions in the sham operation group at three timepoints: 10 days (first row: A,B), 30 days (second row: C,D), and 60 days (third row: E,F). Dotted circles: wound areas, black arrows: macrophages, red arrows: blood vessels, green arrows: granulocytes, grey arrows: lymphocytes, yellow arrows: fibroblasts, blue arrow: plasma cells. (HE-stainings, 10× and 40× objective magnifications with scale bars: 100 µm and 20 µm, respectively).

