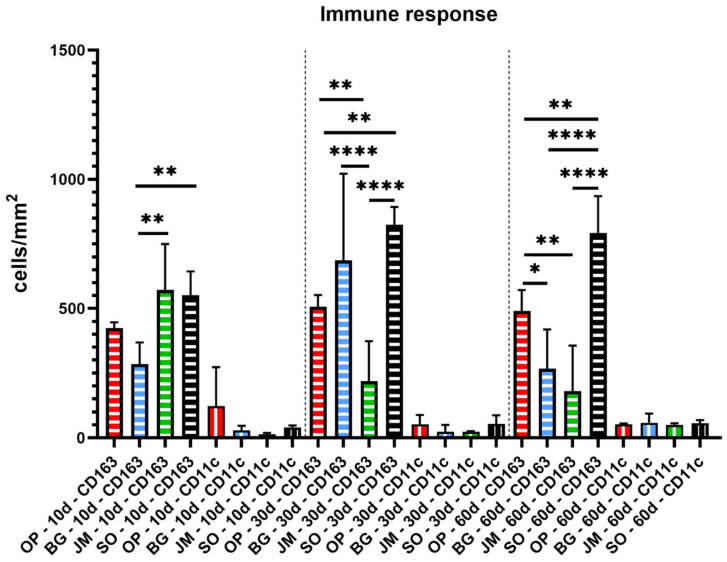
Figure 8.
Statistical analysis of the histomorphometrical results of the immune response within the implantation bed of the analyzed barrier membranes (Ossix® Plus (red), Bio-Gide® (blue), Jason® membrane (green)) and of the sham operation (black). Vertical stripes: CD11c and horizontal stripes: CD163. (* p ≤ 0.05, ** p ≤ 0.01, **** p ≤ 0.0001).

