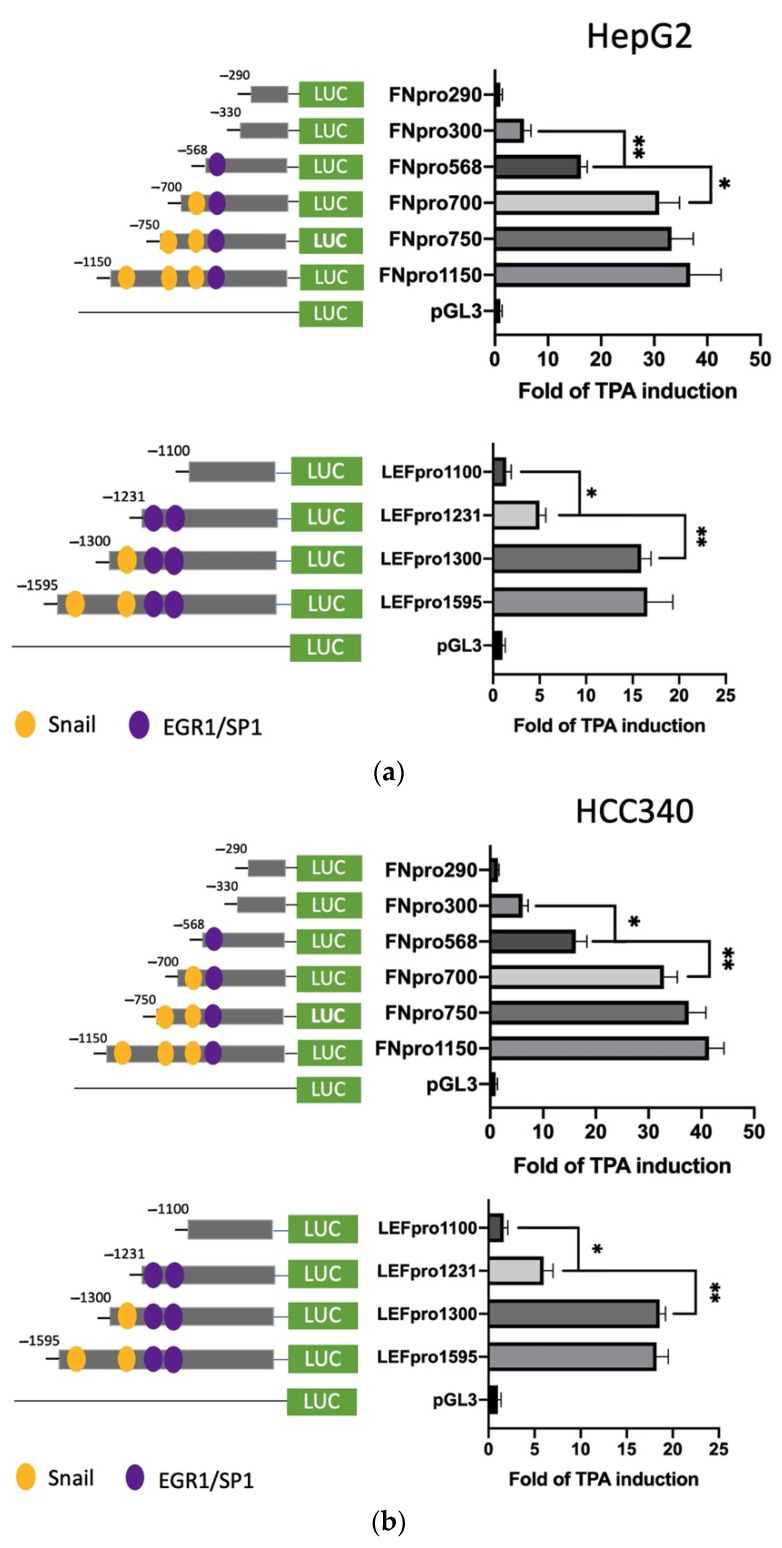
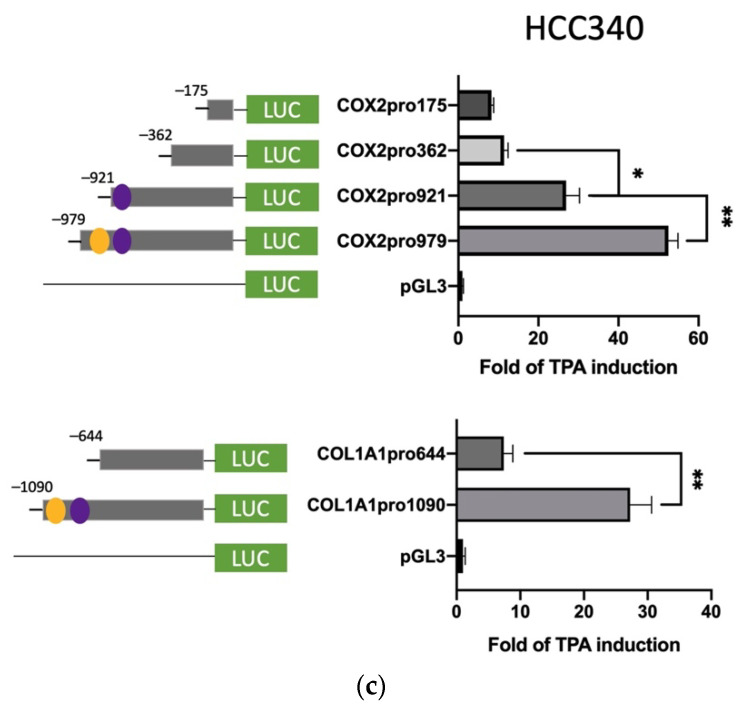
Figure 3.
Deletion mapping for identifying TPA-responsive element on FN, LEF, COX2, and COL1A1 promoter. HepG2 (a) and HCC340 (b,c) cells were transfected with PGL3, the full-length promoter of FN (FNpro1150) (a and b, upper panel), LEF (LEFpro1595) ((a,b), lower panel), COX2 (COX2pro921) and COL1A1 (COL1A1pro1090) ((c), upper and lower panel, respectively) or the promoter constructs deleted from 5′ end of each of the full-length promoters as indicated, followed by TPA treatment for 12 h (a–c). Dual-luciferase was performed. Relative fold of TPA-induced luciferase activity was calculated, taking the data of pGL3 group as 1.0. In each figure, (*, **) represent the statistically significant difference (p < 0.05, p < 0.001, N = 5) between the indicated promoter fragments.


