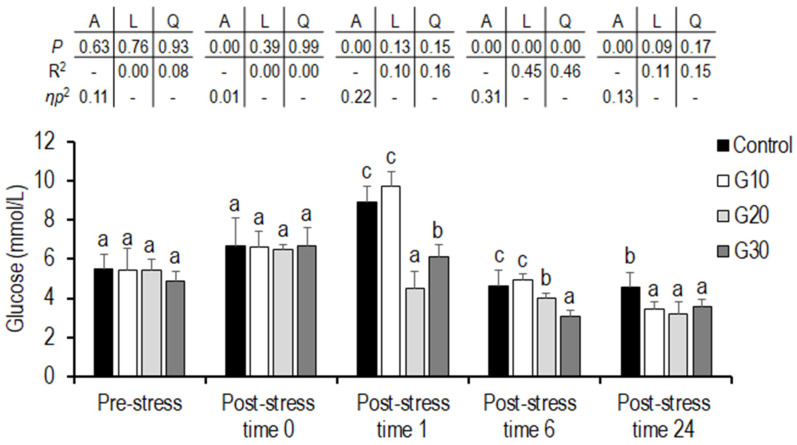
Figure 2.
Serum glucose of Eurasian perch provided feed supplemented with garlic powder under high-density and net handling stress. Values are presented as (mean ± SD; n = 6). Mean values with different superscripts within each time vary significantly according to one-way ANOVA (p < 0.05). A = the variance analysed by one-way ANOVA; L = the linear trend analysed by orthogonal polynomial contrasts; Q = the quadratic trend analysed by orthogonal polynomial contrasts; R2 = R square. ƞp2 = partial eta squared. Control: without garlic supplement; G1: 10 g garlic powder per 1000 g diet; G2: 20 g garlic powder per 1000 g diet; G3: 30 g garlic powder per 1000 g diet. Pre-stress: before stress; Post-stress time 0: immediately after stress; Post-stress time 1: one hour after stress; Post-stress time 6: 6 h after stress; Post-stress time 24: 24 h after stress.

