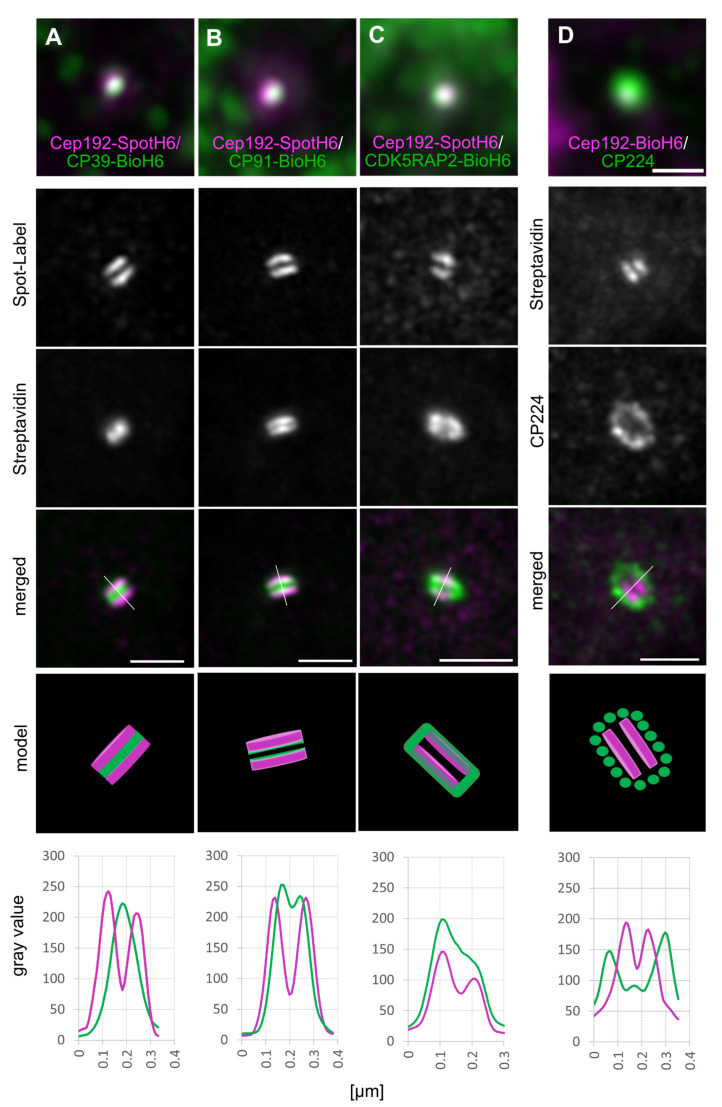
Figure 3.
Subcentrosomal distribution of CP39-BioH6 (A), CP91-BioH6 (B), CDK5RAP2-BioH6 (C), and CP224 (D) relative to Cep192-SpotH6 (A–C) and Cep192-BioH6 (D). First row represents merged images of unexpanded specimen, gray scale images and corresponding merged images are expanded specimen, resulting in the localization models and intensity distribution graphs along the drawn lines in the merged images. Cells were fixed with methanol and stained with anti-Spot-Atto-594 nanobody (A–C), Streptavidin-AlexaFluor-488 (A–D), and anti-CP224/anti-mouse-568 (D). Shown are maximum intensity projections of Airyscan processed (expanded) or deconvolved images (non-expanded). Scale bar = 500 nm, for the expanded specimen the scale was fitted using the expansion factor to represent the original size of the structure.

