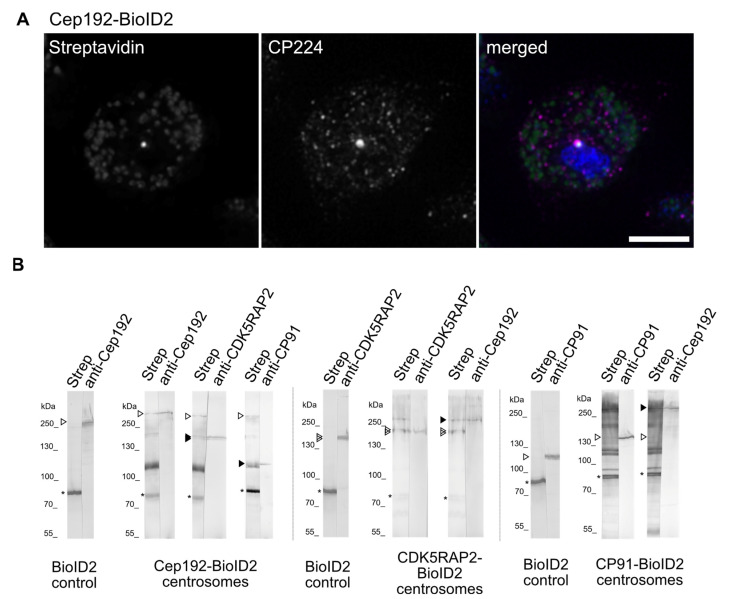
Figure 4.
Centrosomal interactions of C-terminally biotinylase-tagged Cep192, CDK5RAP2, and CP91 in the BioID2 assay. (A) Immunofluorescence microscopy of methanol-fixed Cep192-BioID2 cells after treatment with 2 µM Biotin stained with anti-CP224/anti-mouse-AlexaFluor-568 and streptavidin-AlexaFluor-488, Bar = 5 µm. (B) BioID2 Western blot analysis of centrosomal fractions of Cep192-BioID2, CDK5RAP2-BioID2, and CP91-BioID2 cells. The nitrocellulose membrane was cut into lanes, whereby each lane was cut into equal halves. After blotting, half-lanes were stained with the indicated antibodies and streptavidin, respectively. ‘Strep’ refers to the individual biotinylation pattern detected by alkaline phosphatase coupled Streptavidin. Open arrowheads represent the fusion proteins and the respective endogenous proteins in the control cells, the size difference is due to the 27kDa BioID2 tag. Filled arrow heads highlight potential interactors found by co-staining with their respective antibody. As secondary antibody anti-rabbit-alkaline-phosphatase was used. Bands were visualized using NBT/BCIP color detection. Controls expressed FLAG-BioID2 alone and were treated the same way. Stars indicate endogenously biotinylated proteins always visible in streptavidin staining.

