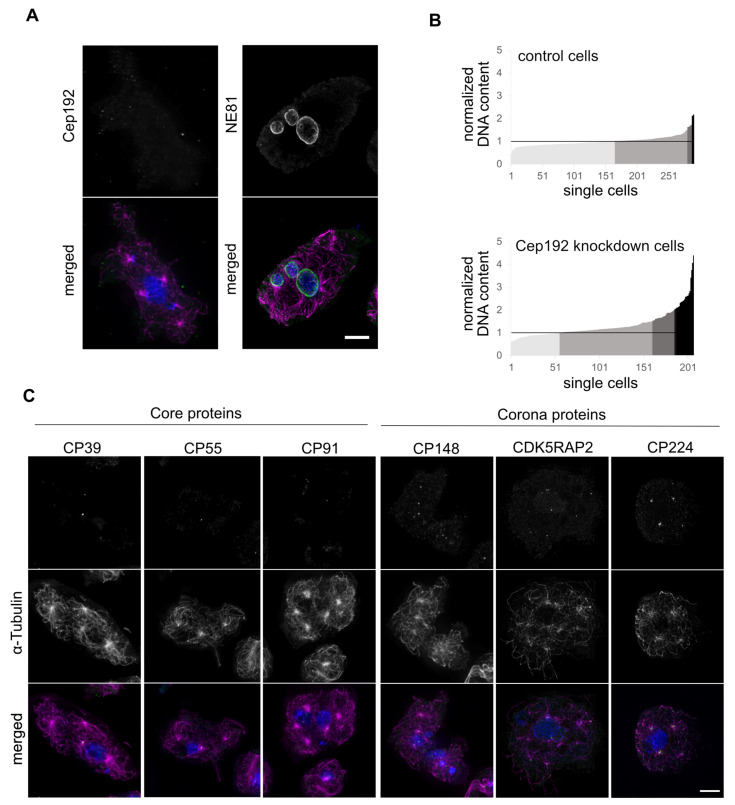
Figure 6.
Cep192-RNAi results in supernumerary MTOCs and increased DNA content. (A) Cells with supernumerary MTOCs stained with anti-Cep192 or anti-NE81 and anti-α-Tubulin (magenta). (B) Comparison of DNA content of control cells expressing GFP-α-Tubulin [51] with Cep192-RNAi cells. Cells were mixed for immunofluorescence microscopy and were distinguishable by GFP fluorescence. DNA content is determined by the product of intensity (16-bit gray scale) and area (µm2) of the DAPI staining for n = 290 control cells and n = 207 Cep192-RNAi cells. The mean control value of the product was set to one for normalization. Increase in DNA content is shown in the graphs and indicated by darkening gray scale: darker gray indicates cells with 1.5-fold higher, black over twofold higher, DNA content. (C) Immunofluorescence microscopy of Cep192-RNAi cells with α-Tubulin and different stainings for indicated core and corona proteins. Cells in A and C were fixed with methanol and secondary antibody was anti-rabbit-AlexaFluor-488 and anti-rat-Alexa-Fluor-568. DAPI was used for DNA staining in the merged images. Maximum intensity projections of deconvolved images are shown. Bar = 5 µm.

