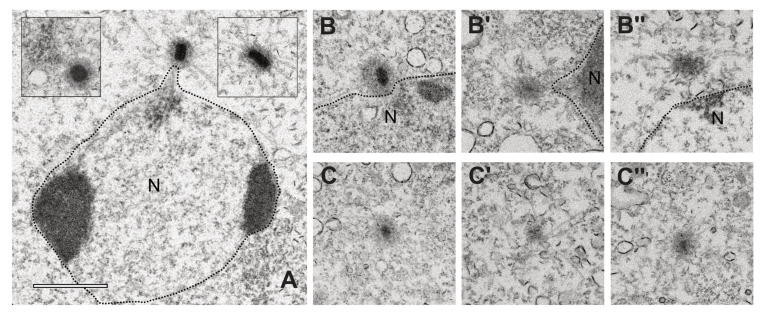
Figure 7.
TEM images of centrosomes and MTOC. Centrosomes of AX2 control cells (A, with insets) and Cep192-RNAi centrosomes (B–B’’) and MTOCs (C–C’’). The image of the control centrosome shows the attachment of the centrosome at the nucleus (N), the two insets show two different orientations of the core structure, with a view on top (left) and from the side (right). The cells were fixed with glutaraldehyde and after embedding sliced and imaged as 80–90 nm thick slices. Bar = 1 µm.

