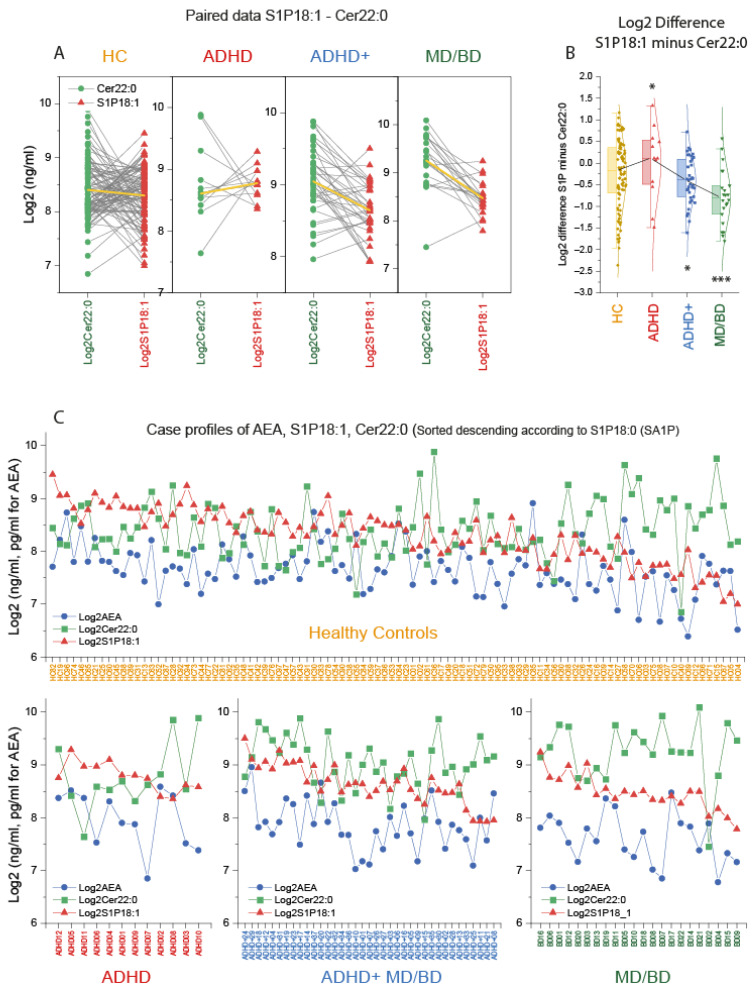
Figure 3.
Case profiles of three key lipids: Cer d18:1/22:0, AEA, and S1P d18:1. (A): Paired analysis of the subjects’ log2 plasma concentration of ceramide 22:0 (Cer22:0) and sphingosine-1-phosphate (S1P d18:1) in patients with attention-deficit/hyperactivity disorder (ADHD), ADHD with comorbidity of major depression (MD) or bipolar disorder (BD) (ADHD+), patients with MD/BD without ADHD, or healthy controls (HC). The yellow lines show the group means. (B): The box plots show the log2 difference of S1P d18:1 and Cer22:0 concentrations per subject (S1P d18:1 minus Cer22:0). The box is the interquartile range (IQR), the black line connects the medians. The scatters are the subjects, and the whiskers show the range within 1.5× the IQR. The Gauss curves show the distribution. According to Dunnett, data were compared with one-way ANOVA and subsequent posthoc analysis versus HC with adjustment of alpha. * p <0.05, *** p <0.001. (C): Log2 concentrations for each subject of the candidate lipids, anandamide (AEA), ceramide 22:0 (Cer22:0) and sphingosine-1-phosphate (S1P d18:1). The cases are sorted from left (high) to right (low) according to the S1P d18:0 (sphinganine-1-phosphate) level, which is not depicted because the information is redundant to S1P d18:1. There are two ADHD patients, who according to the lipid profile, would better fit into the ADHD+ group.

