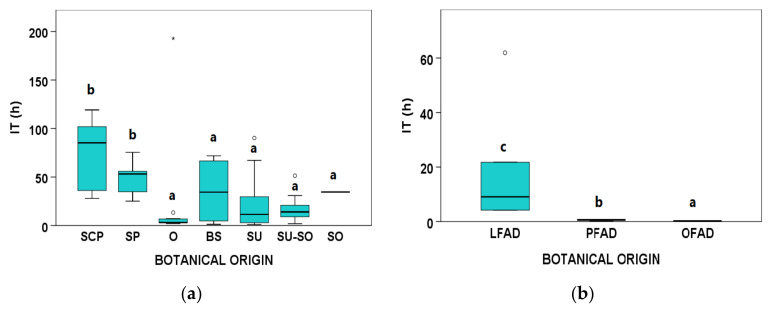
Figure 3.
Boxplots for induction time (IT) measured by Rancimat at 120 °C according to botanical groups for (a) acid oils (AO) from chemical refining (n = 69, because in 10 AO samples the IT could not be determined) and (b) fatty acid distillates (FAD) from physical refining (n = 13) (see Table 1 for abbreviations of botanical groups). Within each type of byproduct (AO or FAD), botanical groups bearing different letters (a–c) show significantly different medians (p ≤ 0.05) according to Kruskal–Wallis test and stepwise multiple comparisons for independent samples. ° Outliers: samples with values between (Q3 + 1.5 × IQR) and (Q3 + 3 × IQR) or between (Q1 − 1.5 × IQR) and (Q1 − 3 × IQR). * Extreme outliers: samples with values above (Q3 + 3 × IQR) or below (Q1 − 3 × IQR).

