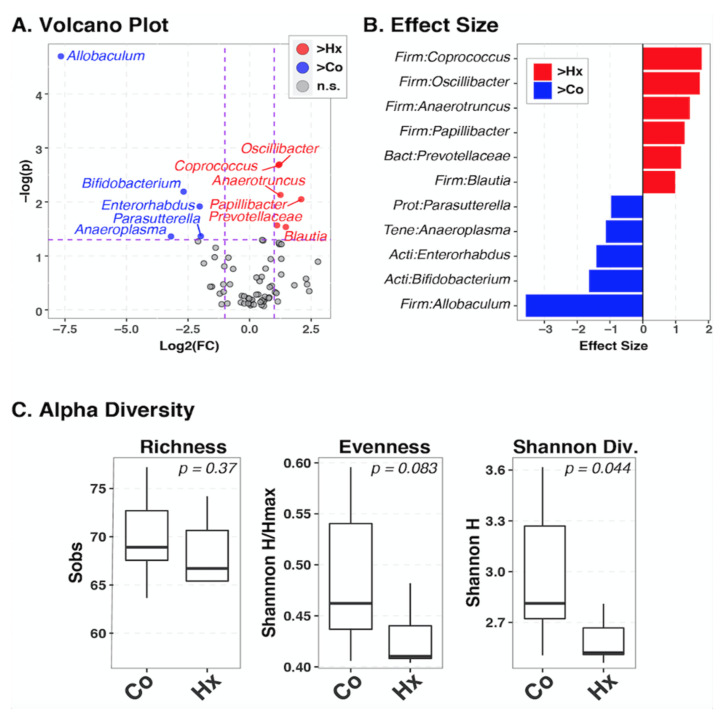
Figure A1.
Identification of bacterial taxa differing between hypoxia and control groups. Between-group differences in the relative abundance of individual bacterial taxa were identified using the ANOVA-like differential expression (ALDEx2) test, which takes into account the compositional nature of microbiota datasets. Taxa with fold-changes >2 and nominal p-values <0.05 (Welch test) are considered significant; (A): plot of log2(fold-change) vs. −log10(p-values). Taxa in the upper right quadrant, colored red, were significantly enriched in the hypoxia group (Hx) compared to controls (Co). Conversely, taxa in the upper left quadrant, colored blue, were significantly enriched in the control group compared to hypoxia. Gray circles in bottom quadrant were not significant (n.s.). Vertical and horizontal dashed lines indicate the fold-change and p-value cutoffs; (B): Relative effect sizes are plotted for significant taxa. Values >0 (red colors) indicate taxa that were elevated in relative abundance in the hypoxia group compared to controls. Values <0 (blue colors) indicate taxa that were enriched in the control group compared to hypoxia; (C): Alpha-diversity differs between hypoxia and control groups. Boxplots summarize distributions of three measures of alpha-diversity between the Co and Hx groups. p-values were ascertained by Student’s t-test with the Welch approximation. Sobs: Species observed (number of taxa observed in each sample). Hmax: maximum value of the Shannon Diversity index for each sample.

