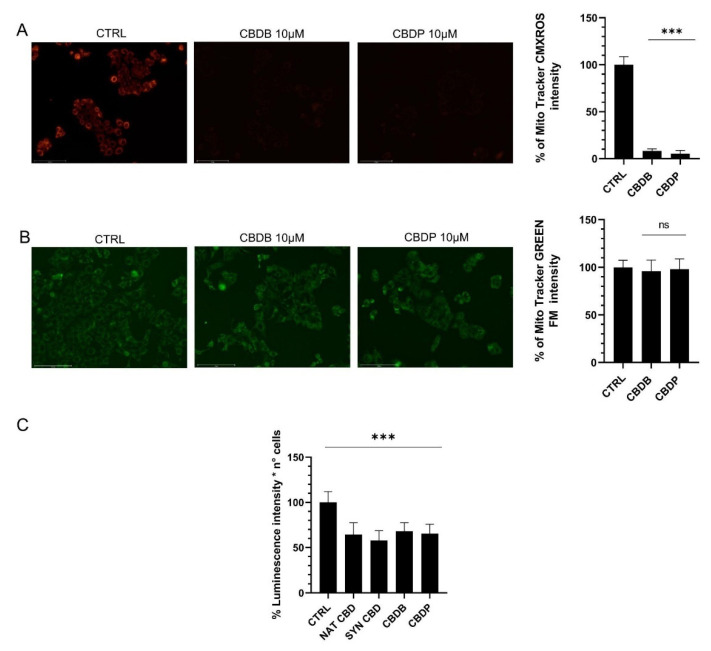
Figure 4.
Representative fluorescent images of the mitochondrial function. MCF-7 cells were treated with vehicle (CTRL), CBDB and CBDP (10 µM) for 24 h. (A) Cells were stained with the membrane potential-dependent dye MitoTracker CMXRos. (B) Cells were stained with the MitoTracker Green FM. Both fluorescent markers were imaged with an Evos m7000 fluorescence microscope. Scale bar 150 μm), objective 20x. (C) After treatments, the cellular ATP level was measured with the CellTiter-Glo 2.0 cell viability luminescence assay. Values are the mean ± SD. *** p < 0.001 compared to controls; ns not significant.

