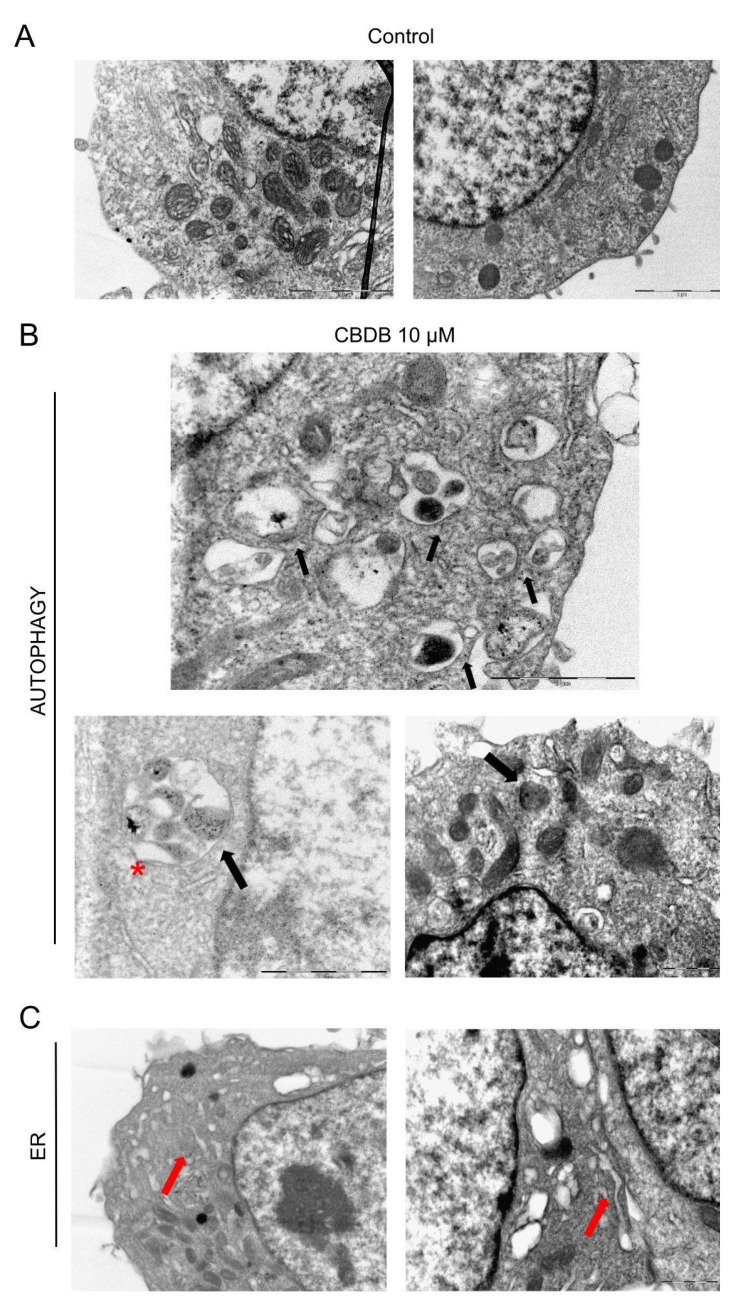
Figure 6.
Representative TEM images of cell morphology. (A) MCF-7 control cells (treated with DMSO, as vehicle). Scale bar 2 μm. (B,C) MCF-7 cells fixed exposed to CBDB or CBDP (10 µM) for 24 h; (B) double-membrane autophagic vacuoles red asterisk, autophagosomes red arrows, (C) outstretched ER black arrows.

