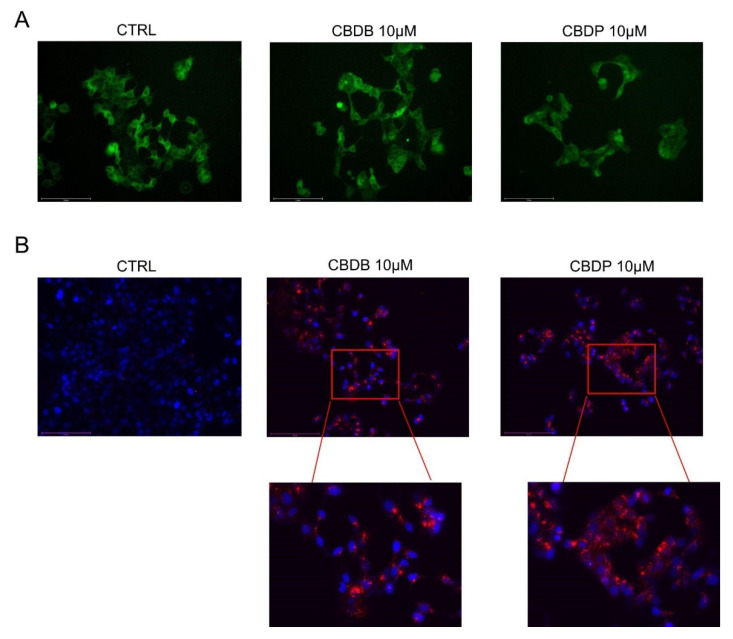
Figure 7.
Representative fluorescent images of organelle structures. MCF-7 cells were treated with vehicle (CTRL) or CBDB and CBDP (10 µM) for 24 h. (A) Cells were stained with ER TrackerTM to visualize endoplasmic reticulum membranes. (B) Cells were stained with Hoechst (0.5 mg/mL) and Lysotracker Red DND-99 (100 nM) according to the manufacturer’s recommendations and imaged with an Evos m7000 fluorescence microscope. Scale bar 150 μm, objective 20×.

