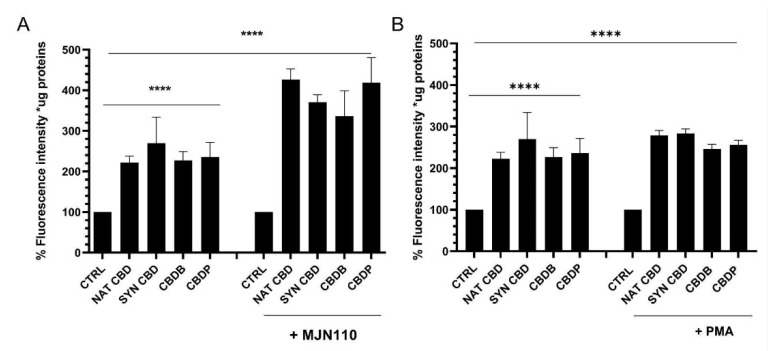
Figure 8.
(A) Intensity quantification by a fluorescence microplate reader for DCFH-DA staining in MCF-7 cells after 24 h treatment with CBD (10 μM), and MJN110 (1 μM) + CBD homologs. Values are the mean ± SD. **** p < 0.0001 compared with controls. (B) Intensity quantification by a fluorescence microplate reader for DCFH-DA staining in MCF-7 cells, including control samples (DMSO) and cells treated for 24 h with CBD (10 μM), and PMA (100 nM) + CBD homologs. Values are the mean ± SD. **** p < 0.0001 compared with controls.

