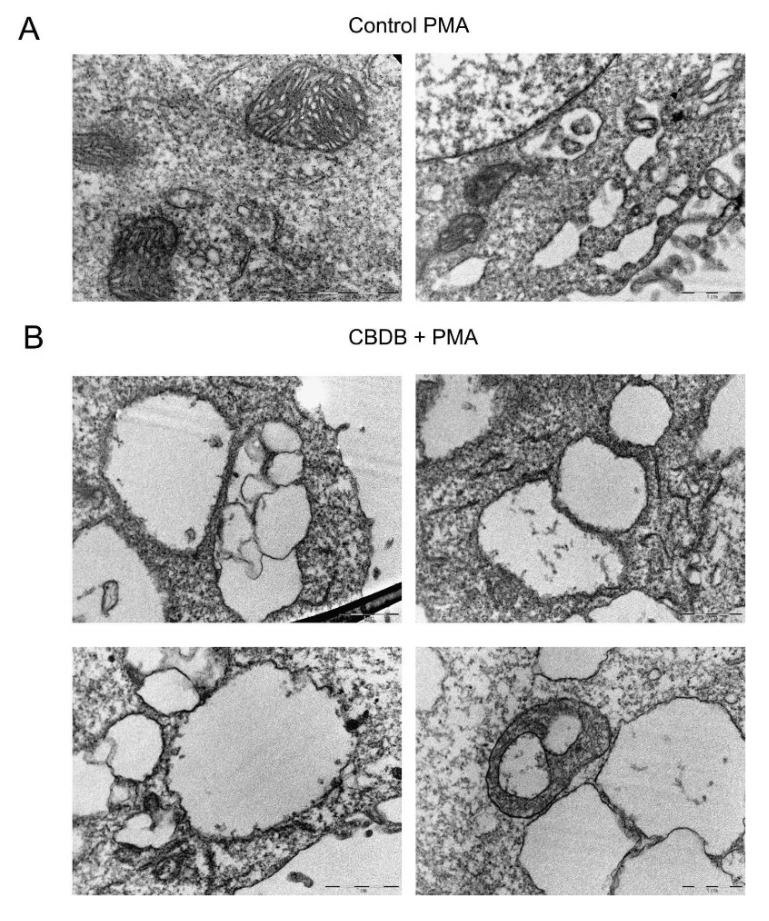
Figure 9.
Representative TEM images of cell morphology. (A) MCF-7 cells were treated with vehicle (DMSO) and PMA (100 nM), showing normal cell organelles. Scale bar 2 μm. (B) MCF-7 cells were incubated with CBDB + PMA (100 nM), highlighting the presence of cytoplasmic vacuolations related to disassembled ER and mitochondria. Scale bar 1 μm.

