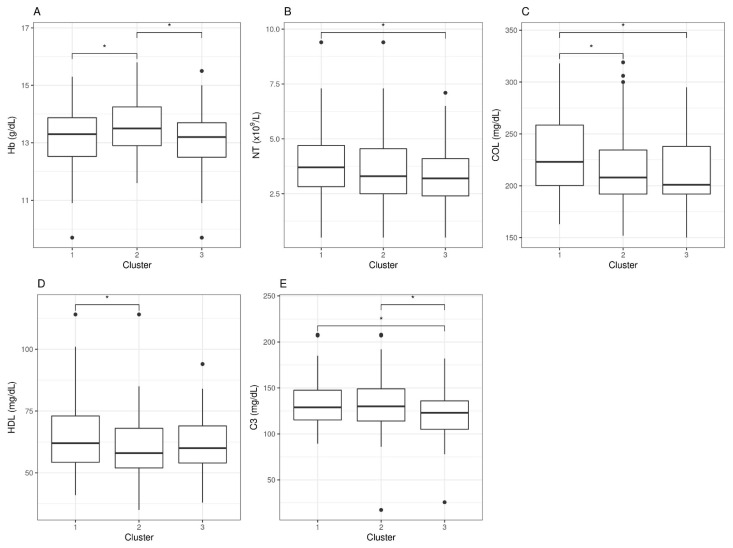
Figure 2.
Blood analytic difference boxplots between ME/CFS symptom-based clusters. Abbreviations: Hb, hemoglobin; NT, neutrophil counts; COL, cholesterol; HDL, high-density lipoprotein; C3, complement 3. The significance level was set at * p < 0.05. Data beyond 1.5 inter-quartile range values, representing potential outliers, are plotted as individual dots.

