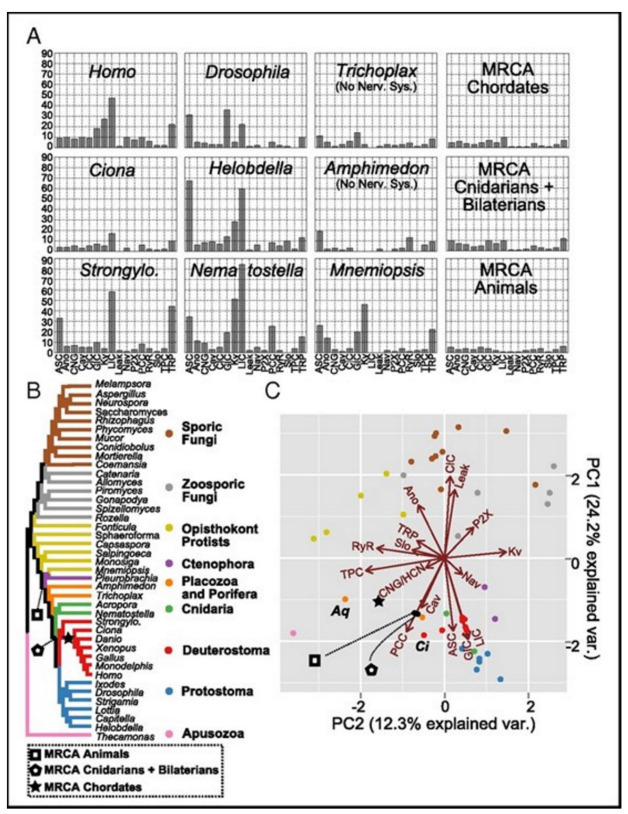
Figure 5.
(A) The count of the channels of the extant and the ancestral species. (B) The species tree shows the relationships between the extant taxa and key ancestral nodes’ locations. (C) The PCA of the normalized gene contents of the ion channels for all tips and three ancestral nodes. The proximity in the space of two PCs indicates identical contents of the gene. The ion-channel families loadings have been presented as vectors. The loading vector size and direction indicate its correlation with corresponding two components. The loading arrows are pointing to the regions where the gene family is found in high relative abundance. The labeled species represent Amphimedon (Aq), and Ciona (Ci).

