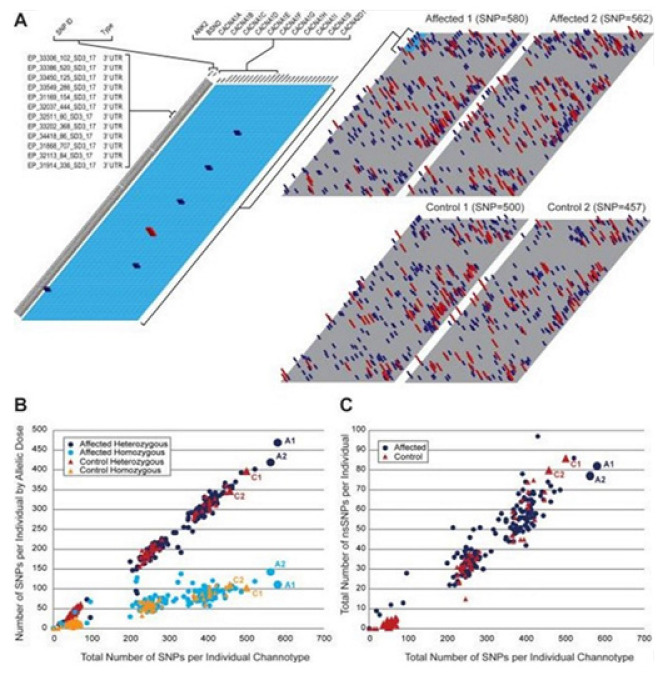
Figure 7.
All variants are to render unique channotype. (A) The low resolution (in gray color background) 3D representation illustrates the extreme channotypes that are present in the cohort study (2 cases and 2 controls, each having >450 SNPs). Columns are to list the genes of the channel subunits in an alphabetical order (ANK—SCN), and rows are to list the validated individual identifiers of the SNP organized in alphabet order by the type (3′UTR—promoter). The enlargement at the left in the teal is presented here for the clarity and the scale. The dosage of the gene of minor (variant) allele for a SNP is denoted here by the bar (tall red = Homozygous Minor Allele; short blue = Heterozygous Minor Allele). Sparsely populated regions present in all four channotypes reflect low frequency novel SNPs. (B) The histogram for all the individuals by the cohort with total SNP number in individual plotted here against the total SNP number in heterozygous or homozygous channotype. The affected and the control cohorts are found to show identical dosages of the allelic with the increasing count of the SNP. (C) The histogram of all of the individuals within every cohort show the total SNP number per individual plotted against the nsSNP number contained in the channotype. The nsSNP number in a channotype increases with the total SNP count increase in both of the populations. The individual channotypes profiled in A. (A1,A2,C1,C2) are indicated in histograms.

