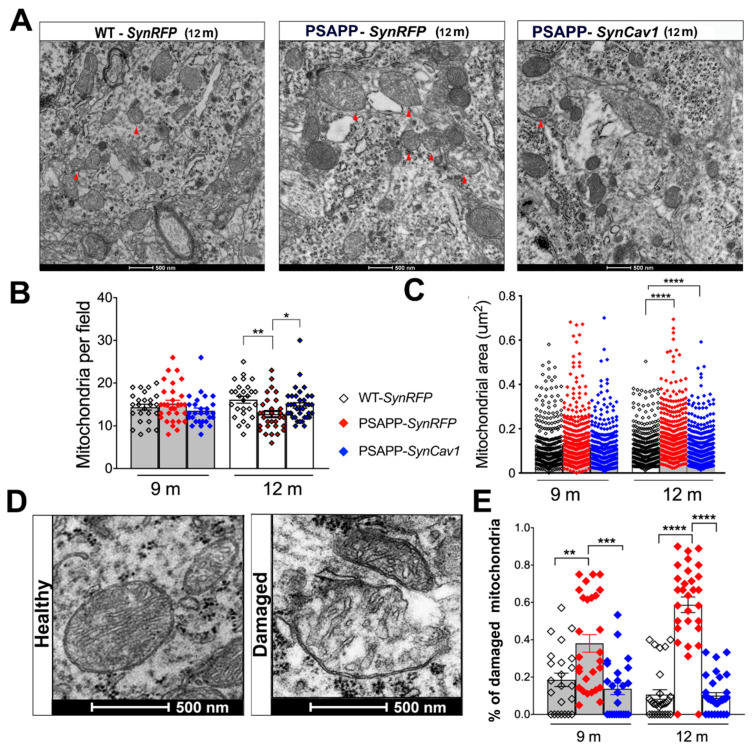
Figure 2.
PSAPP-SynRFP mice exhibit less soma mitochondria with larger area, while PSAPP-SynCav1 shows a similar mitochondria profile as WT-SynRFP. (A) EM images of CA1 molecular cell layer consisting of pyramidal cell bodies in 12 m mice. The red arrow indicates damaged mitochondria with disrupted cristae and empty vacuoles. Quantitation of mitochondrial count and area (B,C). Representative EM image and quantification of damaged mitochondria (D,E). Data are presented as mean ± S.E.M., n = 5 animals per group with 8–12 micrographs per animal. Data were analyzed using One-Way ANOVA. Significance was assumed when p < 0.05. * p < 0.05, ** p < 0.01, *** p < 0.001, **** p < 0.0001.

