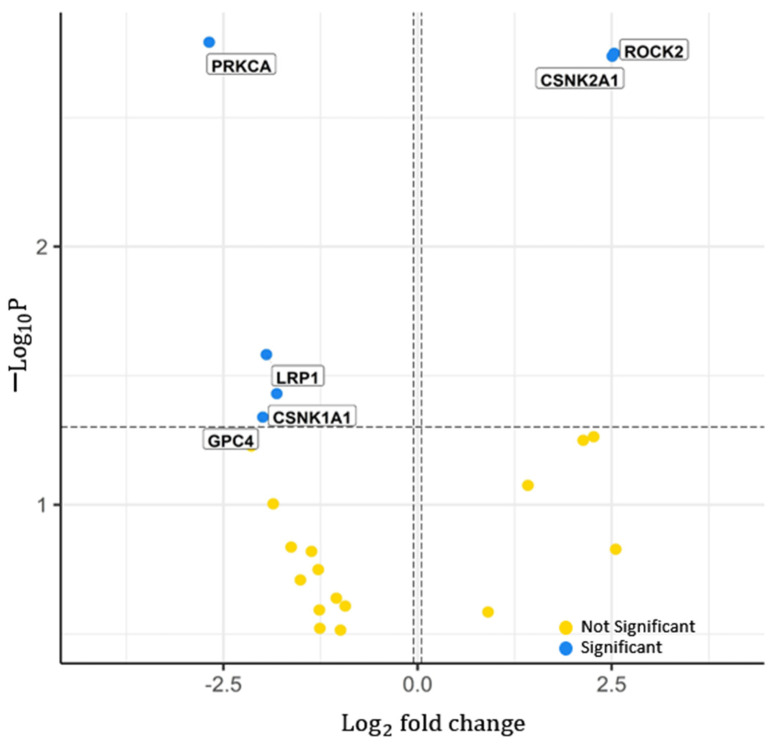
Figure 4.
Significant proteins in the WNT signalling pathway. Distribution of the p-value P) across the hazard ratio ( fold change) from the proteins analysed from proteomics TCGA legacy dataset. Features were divided into two; significant and not significant, represented by the blue and yellow dots, respectively. Labels represent the gene names of some significant features. p-value cut-off used = 0.05. fold change cut-off used = 1. Total number of features in WNT signalling pathway = 119. Total number of significant proteomics determined = 6.

