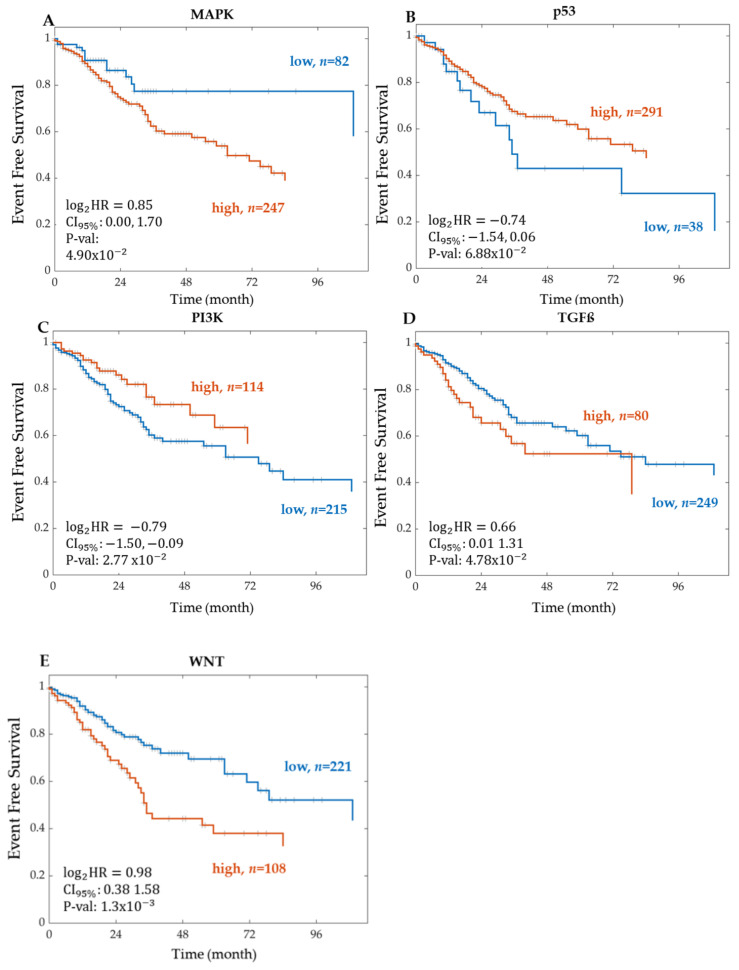
Figure 7.
Kaplan–Meier curves of event-free survival associated with CRC PROGENy pathway activity scores. Kaplan–Meier curves associated with PROGENy pathway activity scores for the signalling pathways (A) MAPK, (B) TGFß, (C) PI3K, (D) p53, and (E) WNT. The patients were stratified into two groups according to the expression level of each feature. The groups are represented as high (orange line) and low (blue line), where n indicates the total number of patients in each group. For each group, the Kaplan–Meier curve of event-free survival was tested for statistically significant differences using a log-rank test. = log base 2 of the hazard ratio. = 95% Confidence Interval. P-val = p-value. RNA Sequencing data is from the TCGA legacy dataset.

