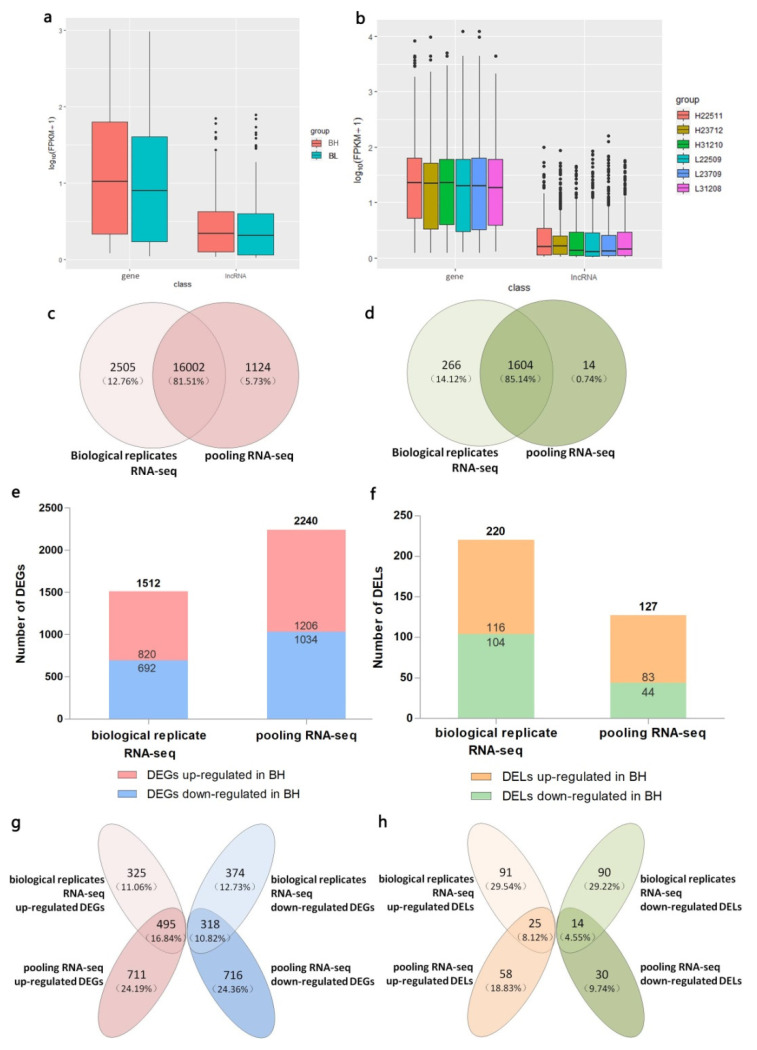
Figure 6.
Comparison of pooling and biological replicate RNA sequencing (RNA-seq). (a) Comparison of expression levels between the genes and lncRNAs in two groups of pooling RNA-seq. The value of log10 (fragments per kilobase of transcript per million mapped reads [FPKM] +1) is plotted on the Y-axis; (b) Comparison of the expression levels between the genes and lncRNAs in six samples of biological replicate RNA-seq; (c) Venn diagram of unique genes between two sequencing methods; (d) Venn diagram of unique lncRNAs between two sequencing methods; (e) Number of differentially expressed genes (DEGs) between BH and BL groups of two sequencing methods; (f) Number of differentially expressed lncRNAs (DELs) between BH and BL groups of two sequencing methods; (g) Venn diagram of DEGs of two sequencing methods; (h) Venn diagram of DELs of two sequencing methods.

