Figure 3.
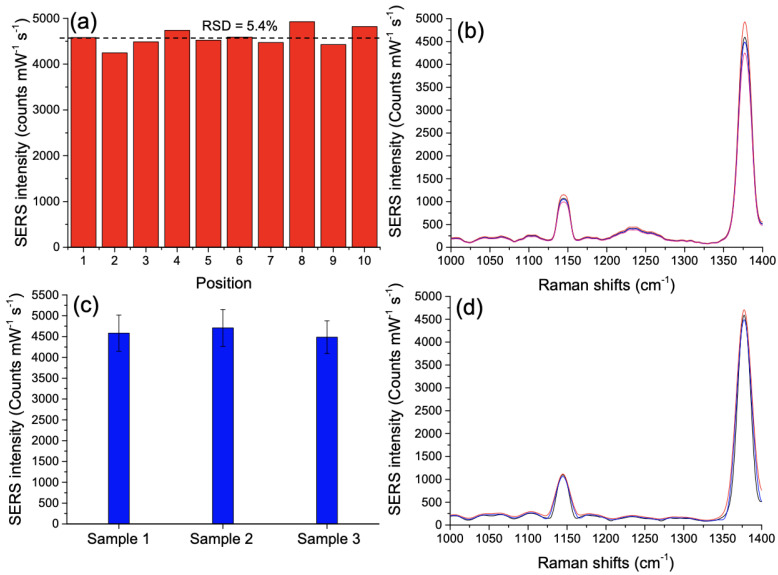
(a) SERS intensity recorded for the Raman peak at 1378 cm at ten positions taken randomly on the substrate (the black dashed line represents the average value of the SERS intensity with a RSD value of 5.4%). (b) SERS spectra for four positions of (a): in red at the position 8, in black at the position 6, in blue at the position 3 and in pink at the position 2. (c) SERS intensity distribution of the 1378 cm peak for three distinct samples with an average RSD < 9%. (d) SERS spectra associated to three samples: in red for the sample 2, in black for the sample 1 and in blue for the sample 3.

