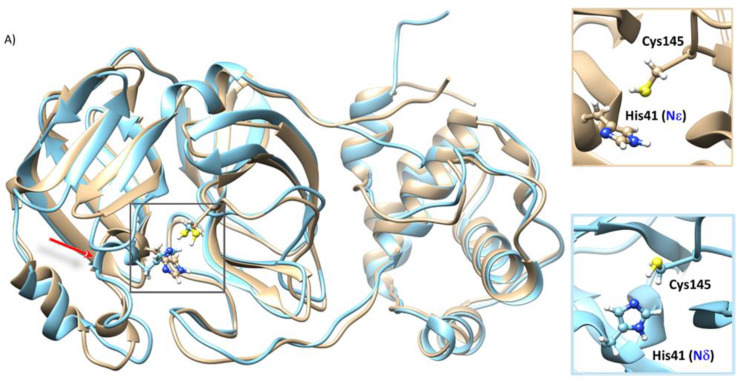
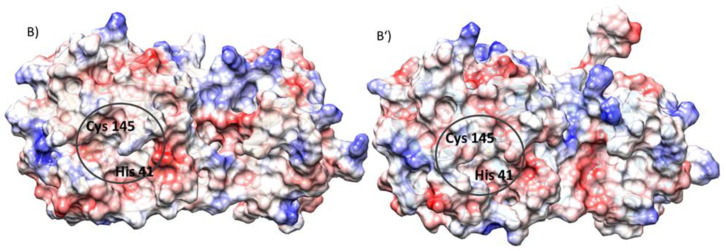
Figure 1.
(A) Alignment of the most representative structure of the SARS-CoV-2 Mpro-HID (cyan) and SARS-CoV-2 Mpro-HIE (gold), as obtained from a cluster analysis along the molecular dynamics trajectories. The insets evidence the structural organization inside the catalytic dyad (His41-Cys145). (B,B’) Electrostatic potential surface (APBS) in the SARS-CoV-2 Mpro-HID (B) and SARS-CoV-2 Mpro HIE (B’).


