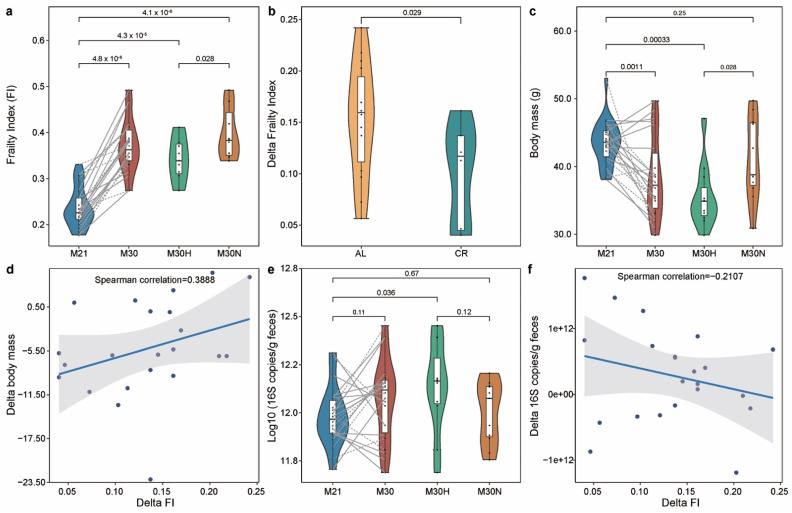
Figure 2.
Frailty index associates with chronological age in mice. (a) Frailty index changes with age. Mice at 30 months of age were grouped into healthy and normal aging based on the median ΔFI. (b) The effect of caloric restriction on the ΔFI between 21 and 30 months of age. (c) Comparison of body mass (BM) for different groups. (d) The association between ΔFI and ΔBM in all mice. (e) Comparison of total bacterial load for different groups. (f) The association between ΔFI and ΔBL in all mice. Points obtained for the same subject from 21 and 30 months of age are joined by solid (AL diet) and dotted (CR diet) lines. p-value shown in (a–c,e) are the result of a Wilcoxon–Mann–Whitney test (unpaired) and a Wilcoxon signed rank test (paired). The correlation coefficient shown in (d,f) is the result of a Spearman correlation. The lines show lm fit for the data, and shaded areas show 95% confidence intervals for the fit.

