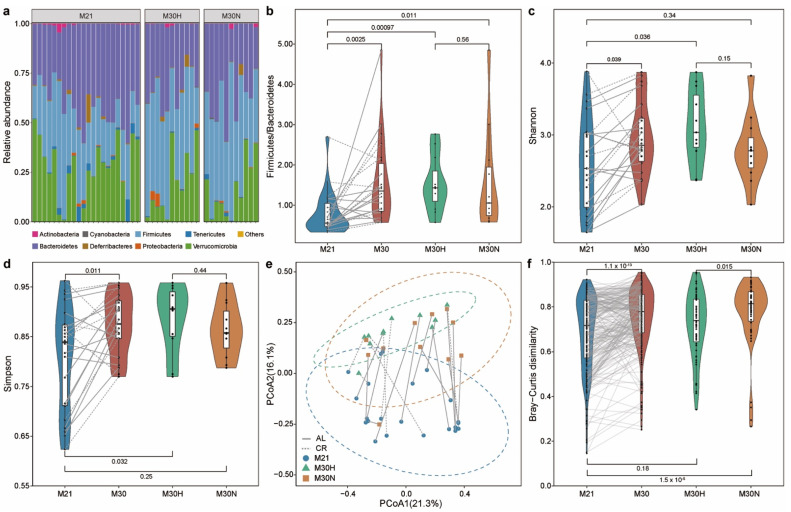
Figure 3.
Impact of aging on gut microbial communities. (a) Relative abundance of bacterial phyla. (b) The ratio of Firmicutes to Bacteroidetes. Alpha diversity using the Shannon (c) and Simpson (d) index. (e) Beta diversity using principal coordinate analysis (PCoA) of Bray–Curtis dissimilarity. The dotted ellipse borders with color represent the 95% confidence interval. (f) Boxplot of gut microbiota Bray–Curtis dissimilarity between subjects within each group. Points obtained for the same subject from 21 and 30 months of age in (b–e) are joined by solid (AL diet) and dotted (CR diet) lines. Points obtained for the same subject pairs from 21 and 30 months of age in (f) are joined by solid line. p-value shown in (b–d,f) are the result of a Wilcoxon–Mann–Whitney test (unpaired) or Wilcoxon signed rank test (paired).

