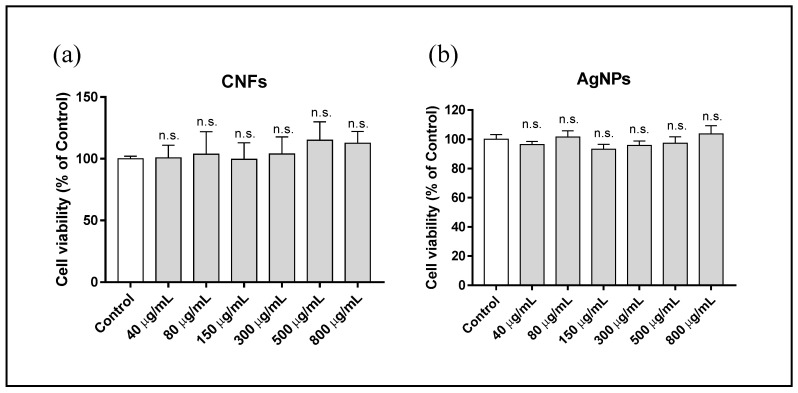
Figure 4.
Cytotoxicity assay in human keratinocyte (HaCaT) cells after 3 h exposure to AgNPs (a) or CNFs (b) at different concentrations ranging from 0 (control) to 800 µg/mL. Cytotoxicity was evaluated by MTT assay. The results are given as a % of the control group. Data are shown as the mean ± standard deviation of six replicates. The ANOVA results of the different AgNP or CNF concentrations with respect to the control are indicated in the plot; n.s: not significant.

