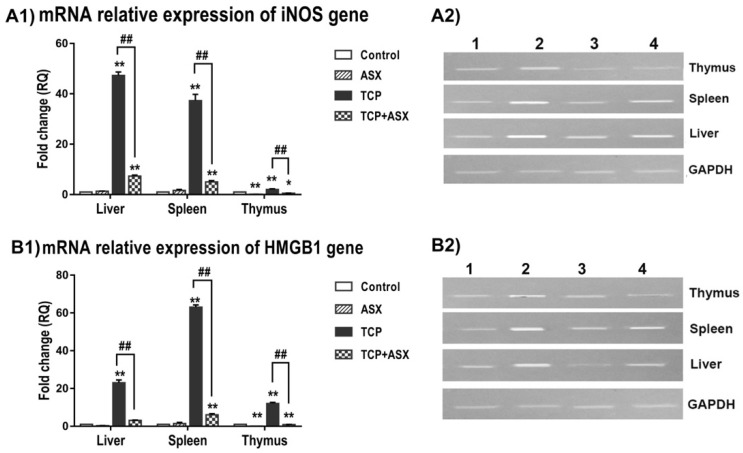
Figure 3.
Quantitative RT–PCR of iNOS and HMGB1 gene expression in liver, spleen, and thymus of various groups. mRNA relative expression of iNOS (A1) and HMGB1 genes (B1), respectively. One-way ANOVA followed by Duncan’s Multiple Range test (mean ± SE). * p < 0.05 and ** p < 0.01 as compared to control. ## p < 0.01 as compared to TCP group. TCP: thiacloprid, ASX: astaxanthin. (A2,B2): cropped gels of electrophoretic mobility of quantitative RT–PCR products of iNOS and HMGB1 genes, respectively, using GAPDH as internal control, on 2% agarose gel. Lane 1: control, lane 2: TCP, lane 3: ASX, lane 4: TCP + ASX.

