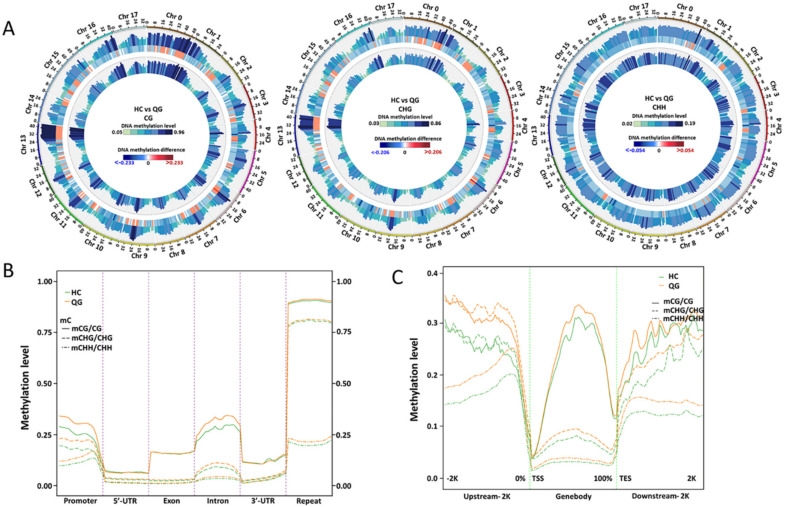
Figure 2.
Comparison of the methylation in the CG, CHG, and CHH contexts in various genomic regions between ‘HC’ and ‘QG’ mature fruits. (A) Circos plots comparing the DNA methylation levels between ‘HC’ and ‘QG’ mature fruits. (B) Comparison of the DNA methylation patterns in various genomic regions between the mature fruits of ‘HC’ (green lines) and ‘QG’ (orange lines). (C) Comparison of the methylation levels in the upstream or downstream regions and gene bodies between the mature fruits of ‘HC’ (green lines) and ‘QG’ (orange lines). Solid lines, mCG; dash lines, mCHG; mixed line, mCHH. TSS, transcriptional start site; TES, transcriptional end site.

