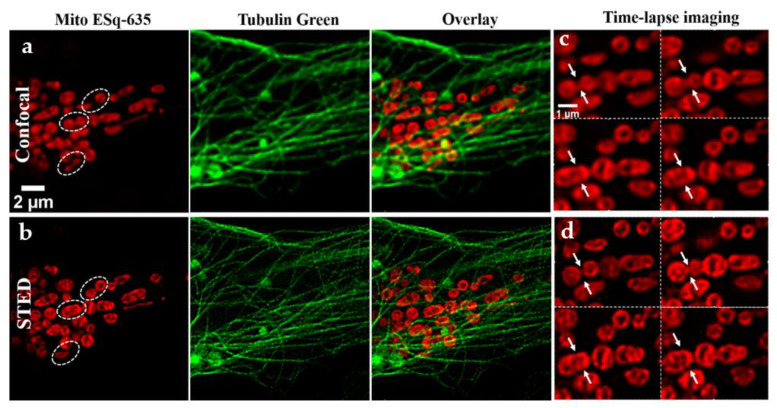
Figure 5.
Long-term dynamic two-color imaging of U2OS cell. (a) Confocal image of mitochondria, tubulin, and their overlay. (b) STED image of mitochondria, tubulin, and their overlay after 12 min. (c) Confocal image of a typical mitochondrial fusion process, as indicated by the white arrow. (d) STED image of a typical mitochondrial fusion process, 3 min per frame. Scale bars: 2 and 1 μm.

