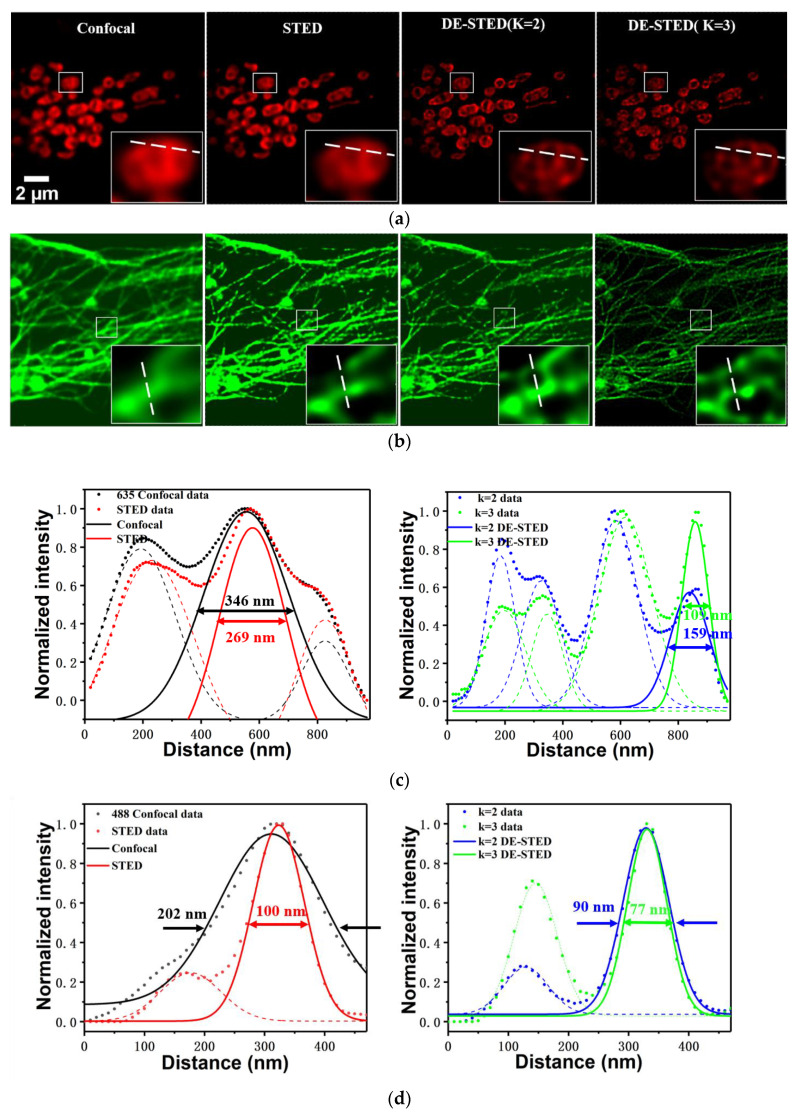
Figure 6.
Two-color DE-STED results from the same living U2OS cell. (a) Confocal and STED (0.8 mW) images of mitochondria, and DE-STED images with k values of 2 and 3. (b) Confocal and STED (0.8 mW) images of tubulin, and DE-STED images with the values of 2 and 3. (c) Normalized intensity profiles along the white dashed lines in (a) for confocal (black curve), STED (red curve) image, and k = 2 (blue curve) and k = 3 (green curve) DE-STED image. (d) Normalized intensity profiles along the white dashed lines in (b) for confocal (black curve), STED (red curve) image, and k = 2 (blue curve) and k = 3 (green curve) DE-STED image. Scale bar: 2 μm.

