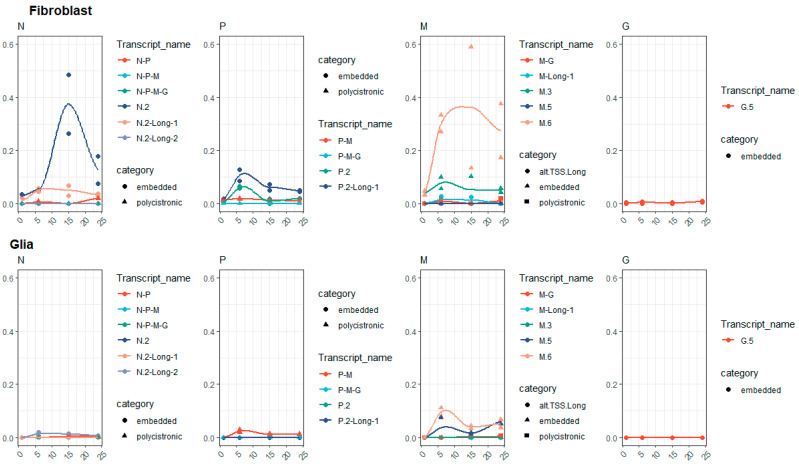
Figure 2.
Relative transcript category expression. This chart illustrates the proportion of different transcript categories (embedded, polygenic, long alternative TSS isoform) compared to the canonic transcripts. The values were calculated as the sum of the expression values of the transcripts in each gene and in each sample divided by the expression values of the canonic transcript in the respective gene and sample.

