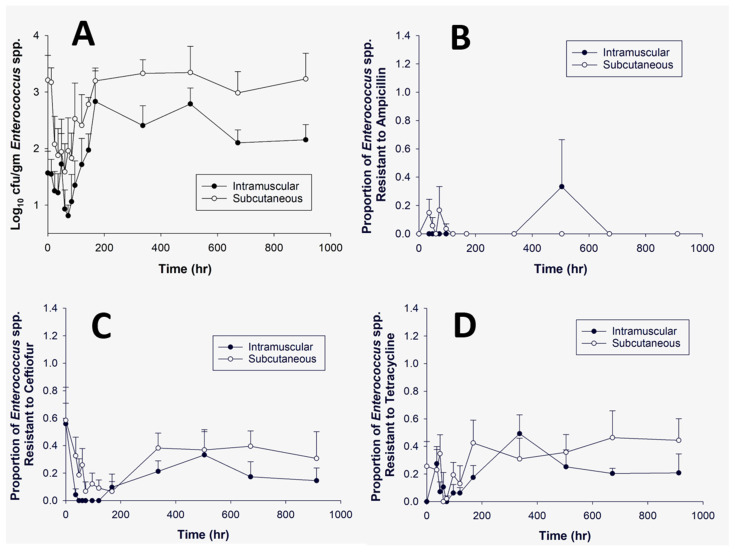
Figure 5.
This panel represents Enterococcus isolates grown over time on no antibiotic (A), ampicillin (16 μg/mL) (B), ceftiofur (8 μg/mL) (C), or tetracycline (16 μg/mL) (D). The dark circle presents the intramuscular dosing group and the open circle represents the subcutaneous dosing group over a 912-h time period. Panel (A) demonstrates the log10 CFU/g of Enterococcus. Panels (B–D) show the proportion of Enterococcus demonstrating phenotypic resistance based on human breakpoints. Bars represent the standard error of the mean. There were no significant differences noted for each dosing group per plain and antibiotic infused plate at the predetermined time points.

