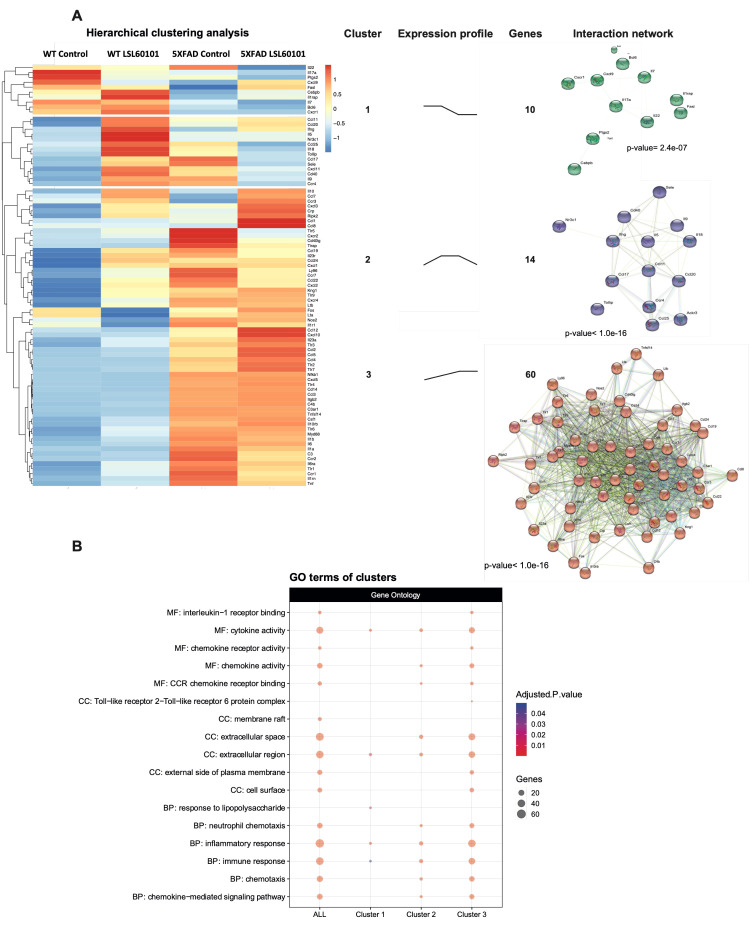
Figure 2.
Hierarchical clustering and gene ontology of inflammatory genes in WT and 5XFAD mice treated with LSL60101. (A) The genes present in the qPCR array were subjected to hierarchical clustering analysis. The heatmap shows three clusters with a specific expression profile between the experimental conditions represented in "expression profile". The predicted protein–protein interactions analysis is shown, as well as the PPI enrichment p-value of each cluster. (B) The dotplot shows the top GO terms of the clusters. An adjusted p-value < 0.05 was considered statistically significant.

