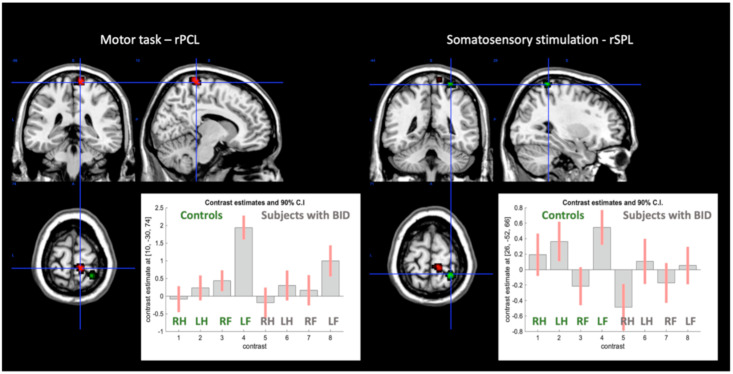
Figure 3.
Regional effects in the right paracentral lobule (red area) and in the right superior parietal lobule (green area), regions that in Saetta et al. [28] had altered functional connectivity. The bar-graphs describe the contrast estimates—betas—and their 90% confidence intervals of the fMRI response for each condition in the healthy controls and in the subjects with BID. RH = right hand; LH = left hand; RF = right foot; LF = left foot.

