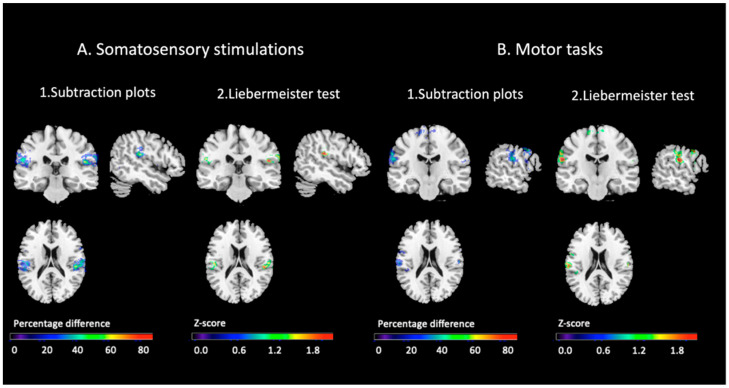
Figure 4.
Comparison of the distribution of the conjunction effects for all somatosensory conditions and all motor task conditions. (A) Somatosensory task and (B) motor task. The Figure shows the subtraction plots between controls and participants with BID in the somatosensory and the motor task (A1 and B1). The percentage overlapping regions of the conjunction of the control group after subtracting the binarized maps of the BID group is illustrated by different colors, coding increasing frequencies from dark blue to red (difference 100%). Only brain regions that were damaged 20% or more frequently in controls than in participants with BID are showed. The figure also shows the result of the Liebermeister test between controls and participants with BID in the somatosensory and motor task (A2 and B2): The color scale illustrates the corresponding Z-score values. Voxels that survived the statistical threshold of p < 0.05 (Z-score = 1.64) uncorrected are shown in red.

