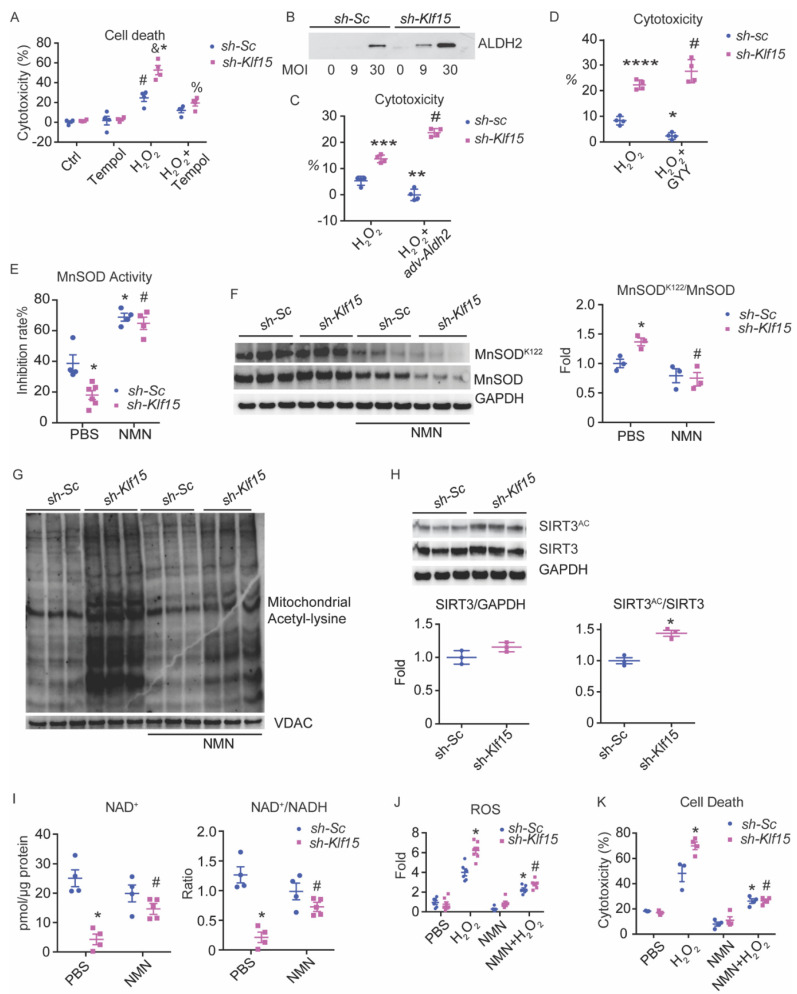
Figure 2.
KLF15 deficiency leads to increased susceptibility to ROS due to NAD+ deficiency. NRVMs were treated with shRNA knockdown of scrambled RNA (sh-Sc) or Klf15 (sh-Klf15). (A) NRVMs were subjected to 3 mM Tempol for 10 min prior to 100 μM H2O2 for 2 h. Percentage of cytotoxicity derived from LDH assay after treatment is shown. (n = 4, *: p < 0.0001 vs. sh-Sc without treatment; #: p < 0.04 vs. sh-Sc without treatment; &: p < 0.001 vs. sh-Sc treated with H2O2; %: p < 0.0002 vs. sh-Klf15 treated with H2O2). (B) Ectopic ALDH2 expression by adenoviral vector in NRVMs detected by immunoblotting. (C) NRVMs were infected with control adenoviral vector (adv-Gfp) or adv-Aldh2 for 48 h. Cell death was then induced by 100 μM H2O2 for 90 min before measurement by LDH assay. (n = 3–4, **: p < 0.01, ***: p = 0.0001 vs. sh-Sc treated with H2O2 and infected with adv-Gfp, #: p < 0.0001 vs. sh-Sc treated with H2O2 and infected with adv-Aldh2). (D) NRVMs were treated with H2S stable releaser GYY4137 or vehicle and then stimulated with 100μM H2O2 for 90 min. Percentage of cytotoxicity derived from LDH assay. (n = 3, *: p < 0.05, ****: p < 0.0001 vs. sh-Sc treated with H2O2, #: p < 0.0001 vs. sh-Sc treated with H2O2 and GYY4137). (E–K) NRVMs were treated with 2 mM NMN or PBS for 24 h. (E) MnSOD activity in NRVMs (n = 4–6, *: p < 0.01 vs. sh-Sc treated with PBS, #: p < 0.001 vs. sh-Klf15 treated with PBS). (F) MnSOD and MnSODK122 acetylation levels were measured by immunoblot and the ratio was calculated based on densitometry (n = 3, *: p < 0.01 vs. sh-Sc treated with PBS, #: p < 0.001 vs. sh-Klf15 treated with PBS). (G) Mitochondrial total protein acetylation was measured using anti-acetyl-Lysine immunoblot blot. VDAC was used as a loading control for mitochondrial protein. (H) SIRT3 and GAPDH protein levels were determined by immunoblot. Acetylation of SIRT3 was determined by immunoblot for anti-acetyl-Lysine after immunoprecipitation with SIRT3 antibody. Quantified ratio was derived from densitometry. (n = 3, *: p = 0.003, two-tailed Student’s t-test). (I) NAD+ level and NAD+/NADH ratio. (n = 4, *: p < 0.001 vs. sh-Sc treated with PBS; #: p < 0.05 vs. sh-Klf15 treated with PBS). (J,K) 100μM H2O2 for 90 min was used to induce oxidative stress. (J) ROS was measured by DHE staining and quantified using NIH Image J (n = 6, *: p < 0.001 vs. sh-Sc treated with H2O2; #: p < 0.0001 vs. sh-Klf15 treated with H2O2). (K) Percentage of cytotoxicity derived from LDH assay (n = 3–4, *: p < 0.0001 vs. sh-Sc treated with PBS; #: p < 0.0001 vs. sh-Klf15 treated with H2O2). Two-way ANOVA with Bonferroni correction was used to determine statistic difference. Data are presented as mean ± SEM.

