Figure 5.
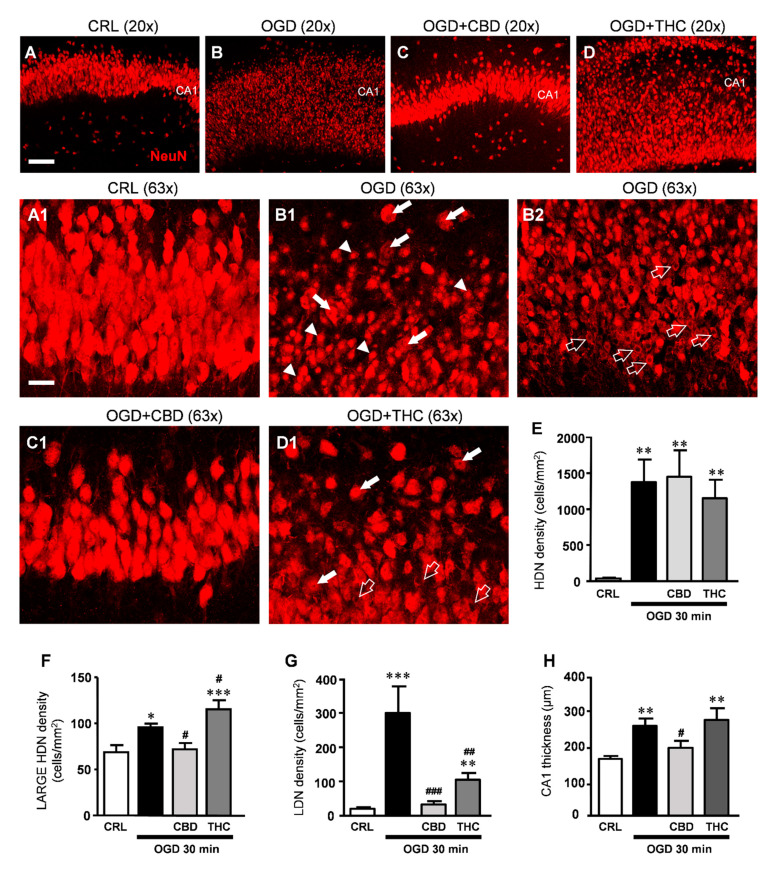
(A–D) Representative confocal images of neurons immunostained using antibodies against NeuN in CA1 of a CRL (A), OGD (B), OGD + CBD (C), and OGD + THC slice (D) captured with a 20x objective, scale bar: 75 µm. (A1–D1) Confocal images obtained stacking 10 consecutive z-scans acquired in the depth of the corresponding slice shown in (A–D), respectively (0.3 µm each, total thickness 3 µm), captured with a 63x objective. A1: Image taken from the control slice in A showing healthy pyramidal neurons in CA1. (B1,B2) Both images of CA1 were taken from the OGD slice in (B) and show clearly that neurons are profoundly damaged after OGD. (B1) HDN neurons (arrowheads), large HDN neurons (white arrows); (B2) LDN neurons (open arrows). (C1) The image of CA1 taken from the OGD + CBD slice in (C) shows that pyramidal neurons have a healthy appearance. (D1) The image taken from the OGD + THC slice in (D) shows large HDN neurons (white arrows) and LDN neurons (open arrows). (A1–D1) scale bar: 20 µm. (E–G) Quantitative analyses of neuronal morphological alterations in CA1. (E) density of HDN neurons. Statistical analysis: one-way ANOVA p < 0.001; ** p < 0.01 vs. CRL, Newman–Keuls post hoc test; (F) density of large HDN neurons. Statistical analysis: One-way ANOVA p < 0.0001; * p < 0.05 and *** p < 0.001 vs. CRL, # p < 0.05 vs. OGD, Newman–Keuls post hoc test. (G) density of LDN neurons. Statistical analysis: One-way ANOVA p < 0.0001; ** p < 0.01 and *** p < 0.001 vs. CRL, ### p < 0.001 vs. OGD, ## p < 0.01 vs. OGD and OGD + CBD, Newman–Keuls post hoc test). (H) Thickness of CA1. Statistical analysis: One-way ANOVA p < 0.01; ** p < 0.01 vs. CRL, # p < 0.05 vs. OGD, Newman–Keuls post hoc test. Bars represent the mean ± SEM of at least 8 experiments.

