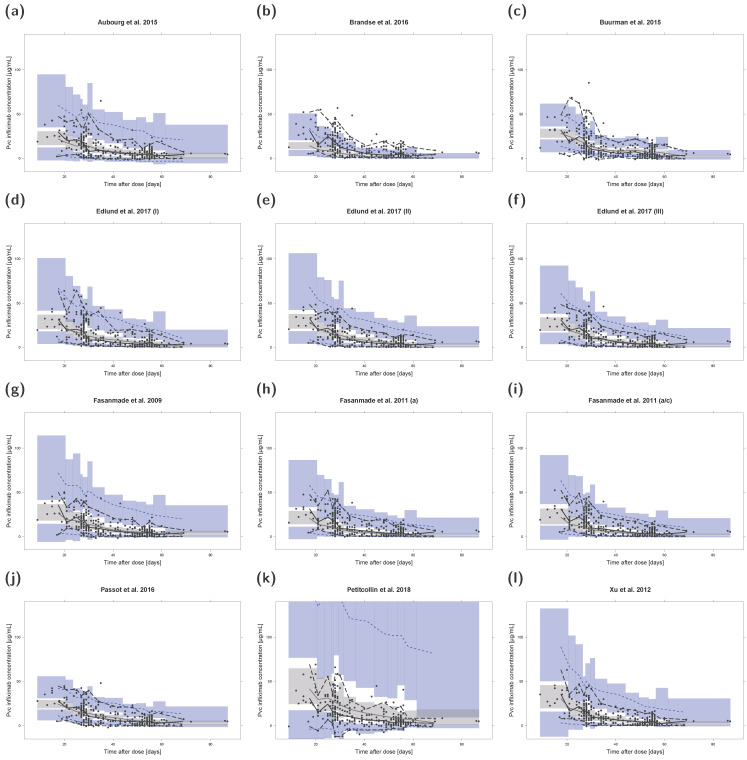
Figure 3.
Prediction- and variability-corrected visual predictive checks (pvcVPCs) of serum infliximab concentrations for each investigated population pharmacokinetic model (a–l). Prediction- and variability-corrected observed concentrations are shown as black circles, observed medians are depicted as black solid lines, 5th and 95th data percentiles as black dashed lines. The model simulations (n = 1000 replicates) are depicted as gray solid lines (median) and blue dashed lines (5th and 95th percentiles). Colored areas represent the simulation-based 95% confidence intervals for the corresponding model-predicted median (gray areas) and 5th and 95th percentiles (blue areas). For ease of comparison, y-axis upper limits were set to 140 µg/mL. Plots with automatic y-axis limits are shown in the Supplementary Materials. a: adults; a/c: adults/children; Pvc: prediction- and variability-corrected.

