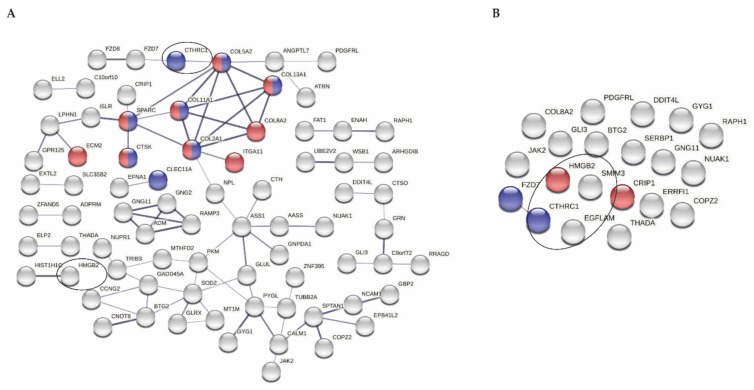
Figure 2.
Protein–protein network. (A) STRING analysis for 114 genes included in whole correlation analyses; indicated in red and blue are significantly enriched pathways (extracellular matrix and ossification, respectively; disconnected nodes are hidden). (B) STRING analysis for 21 unique genes strongly correlating to 34 miRNAs; ρ ≥ |0.7|; indicated in red and blue are significantly enriched pathways (DNA binding and Wnt-protein binding, respectively). Circles point at the 4 genes strongly correlating to levels of at least 10 different plasma miRNAs (EGFLAM and SMIM3 are disconnected in (A)). Note: LINC00115 is missing because this is a non-coding RNA.

