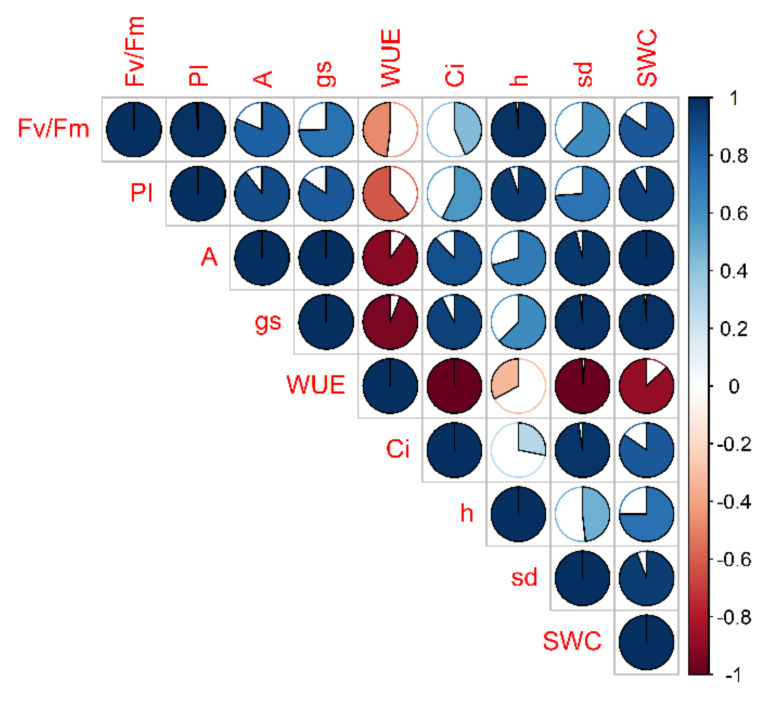
Figure 4.
Correlogram of 9 physiological and morphological traits evaluated in Perina cultivar in the stress treatment at the vegetative stage. Each trait of DS plants is normalized to that of CTRL and then correlated according to time course (t0, t1, t2). The filling of the cake corresponds to the value of the correlation coefficient (full cake means unit correlation, in absolute value) while the color indicates the sign (blue/red means positive/negative correlation coefficient).

