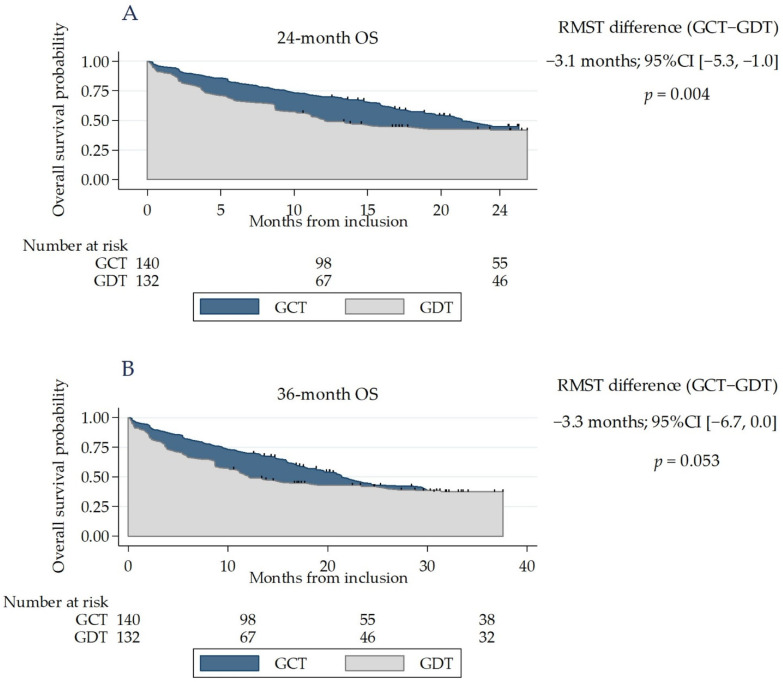
Figure 2.
Kaplan–Meier curves for overall survival in the GDT and GCT groups. The area in blue represents the difference in the restricted mean survival time (RMST). (A) The weighted population, using SIPTW of propensity scores for 24-month OS. (B) The weighted population, using SIPTW of propensity scores for 36-month OS. GCT: guideline-concordant treatment, GDT: guideline–discordant treatment.

